Read Artifacts And ROM Source
Debug80 writes build artifacts during launch and loads monitor assets for monitor-backed profiles. You do not need to inspect these files every time you debug, but knowing their roles makes breakpoints, ROM source and hardware transfer easier to understand.
The Build Folder
After a successful launch, open the build/ folder. Debug80 writes the files produced by AZM there.
The target controls the folder and base name. In a scaffolded project, outputDir is usually build, and artifactBase is often main. That gives file names such as:
build/main.hex
build/main.lst
source-map output
Image placeholder: Explorer showing
build/main.hex,build/main.lstand the generated source-map file.
These files are generated output. Keep editing the source, not the artifacts. Rebuild when you want the artifacts to change.
Intel HEX
The .hex file contains the generated program bytes in Intel HEX format. Debug80 loads those bytes into the emulated Z80 memory when it starts the session.
The same .hex file is the file Debug80 sends to a real board through CoolTerm. Chapter 7 uses it for the hardware transfer.
This gives the emulator and the board a shared program image. You debug the program in VS Code, then send the generated HEX file to the real machine.
Listing
The .lst file is the assembler listing. It gives you a build-side view of generated bytes and symbols.
Use the listing when you want to check where AZM placed a label or which bytes were generated for a short sequence. Debug80 can also use listing information as a fallback when higher-confidence map data is unavailable.
Image placeholder: Source file beside a small listing excerpt, with matching address highlighted.
The listing is useful when you want to answer a low-level question: which address did this label receive, or which bytes did this short instruction sequence generate?
Source Map
The source map records source files, generated address ranges and symbols in a form Debug80 can read. Debug80 uses the source map from the last successful build.
When you set a breakpoint in source, Debug80 needs an address for that source line. When execution stops at an address, Debug80 needs a source line to show in the editor. The source map supplies that relationship.
You do not need to understand the file format during normal debugging. Keep the operating rule simple: if navigation, symbols or breakpoints look stale, build the target again.
The source map is the reason source-level debugging works after assembly. The Z80 executes addresses and bytes. You write files and lines. Debug80 needs a map between those two worlds.
Go To Definition
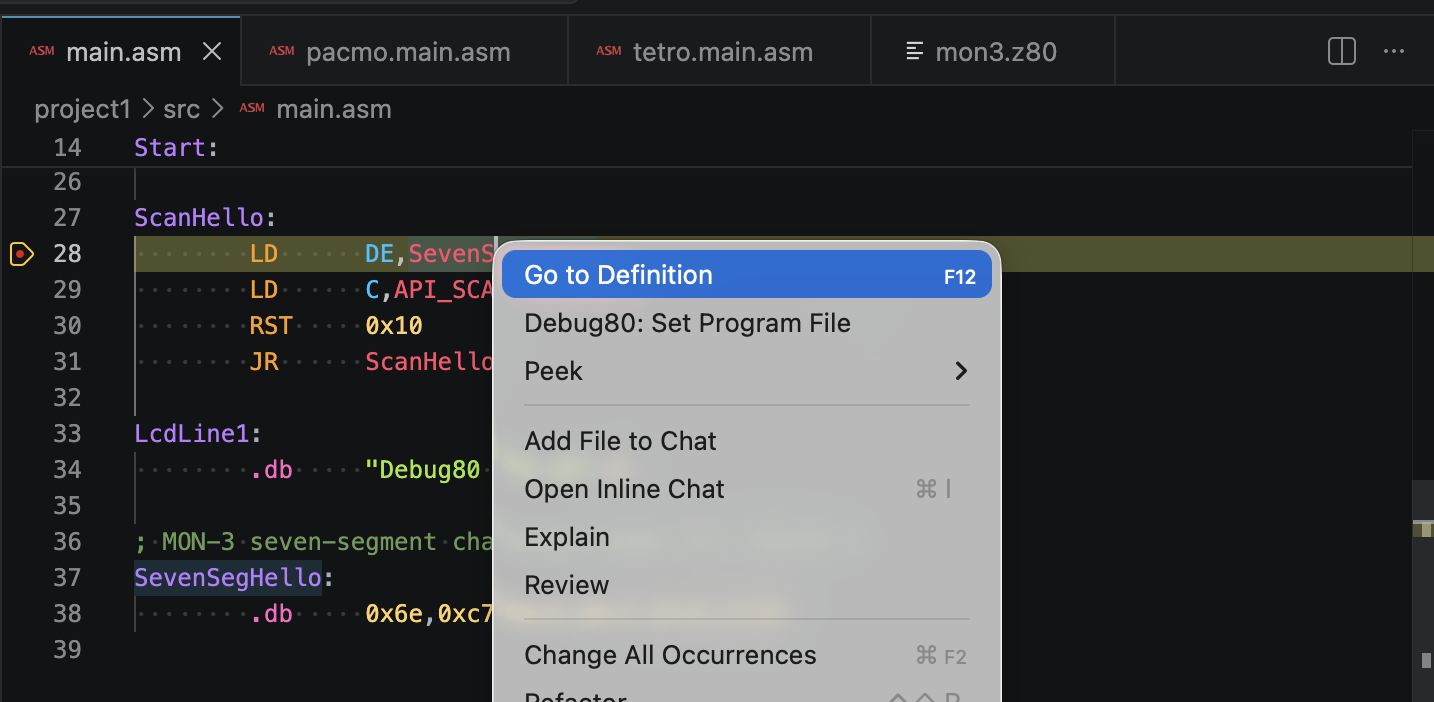
After a successful build, Debug80 can navigate from a symbol reference to the symbol definition.
Place the cursor on a symbol in a .asm, .z80 or .asmi file and press F12, or run VS Code’s Go to Definition command. Debug80 uses the source map from the last successful build and opens the definition location.
The last successful build is the source of truth. Debug80 does not continuously parse the file you are editing for this feature. Build again after changing labels, constants or include files.
If the source map is missing, Debug80 asks you to build the target first. If the source map may be stale, Debug80 warns that rebuilding may improve accuracy.
Image placeholder: Source editor with cursor on a symbol and the definition target shown after F12.
Workspace Symbol Search
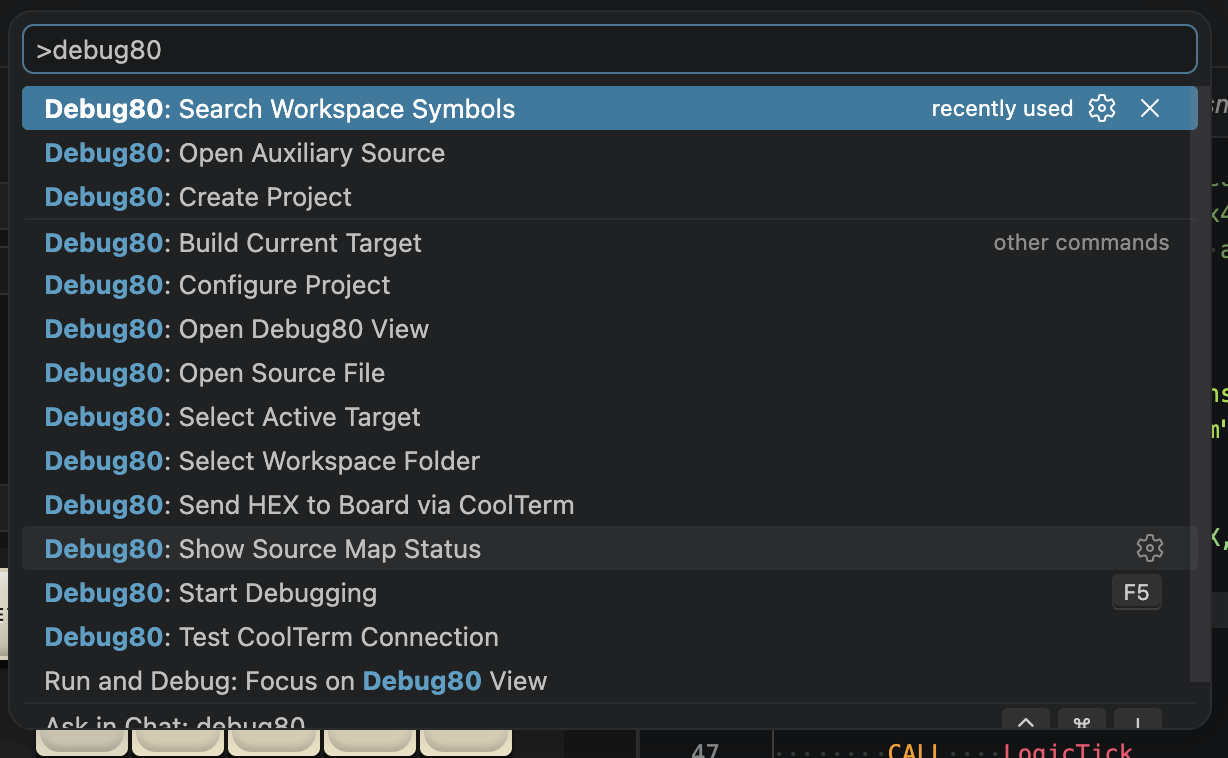
VS Code’s Go to Symbol in Workspace command can search symbols contributed by Debug80. Debug80 contributes labels, constants, routines and data symbols from the active target.
Only the active Debug80 target is used. This is target-based symbol lookup, not whole-workspace semantic indexing. If you change targets, build the new target before relying on symbol search.
Image placeholder: VS Code workspace symbol picker showing Debug80 symbols from the active target.
Symbol Hover
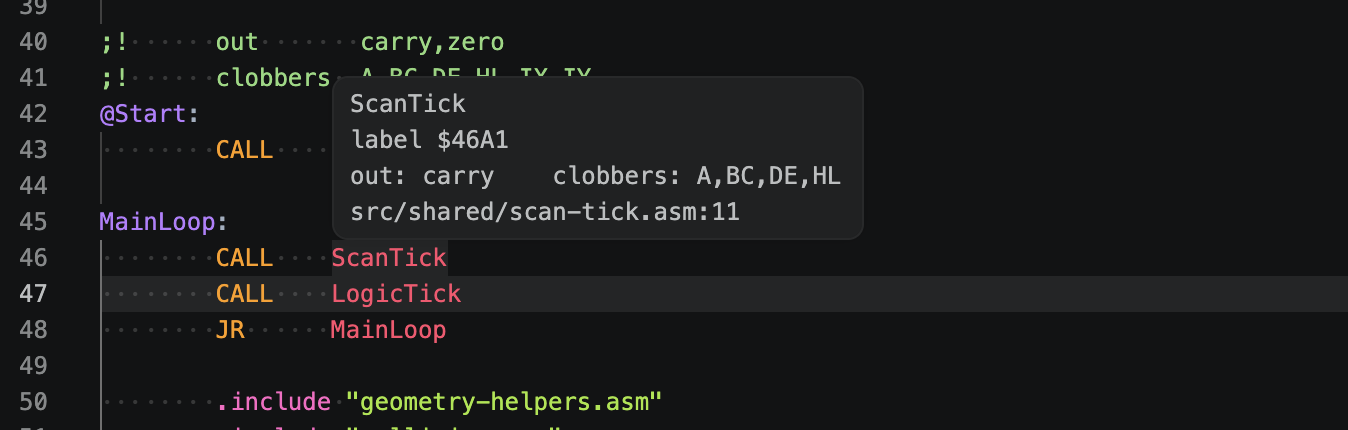
Hover over a known assembly symbol to see a compact summary from the source map. The summary can include the symbol name, kind, address or value, source file and line.
For routines with nearby AZMDoc register-care comments, Debug80 can also show a one-line contract summary:
in: A,HL out: carry clobbers: B,C preserves: DE,IX
Hover appears only for symbols that resolve through the source map. Build the target if hover is missing for a symbol you expect Debug80 to know.
Image placeholder: Symbol hover showing name, kind, address and source location.
Monitor ROM
The TEC-1G / MON-3 project runs with monitor ROM in the emulated machine. Your program starts at 0x4000, while reset code and monitor routines live in ROM.
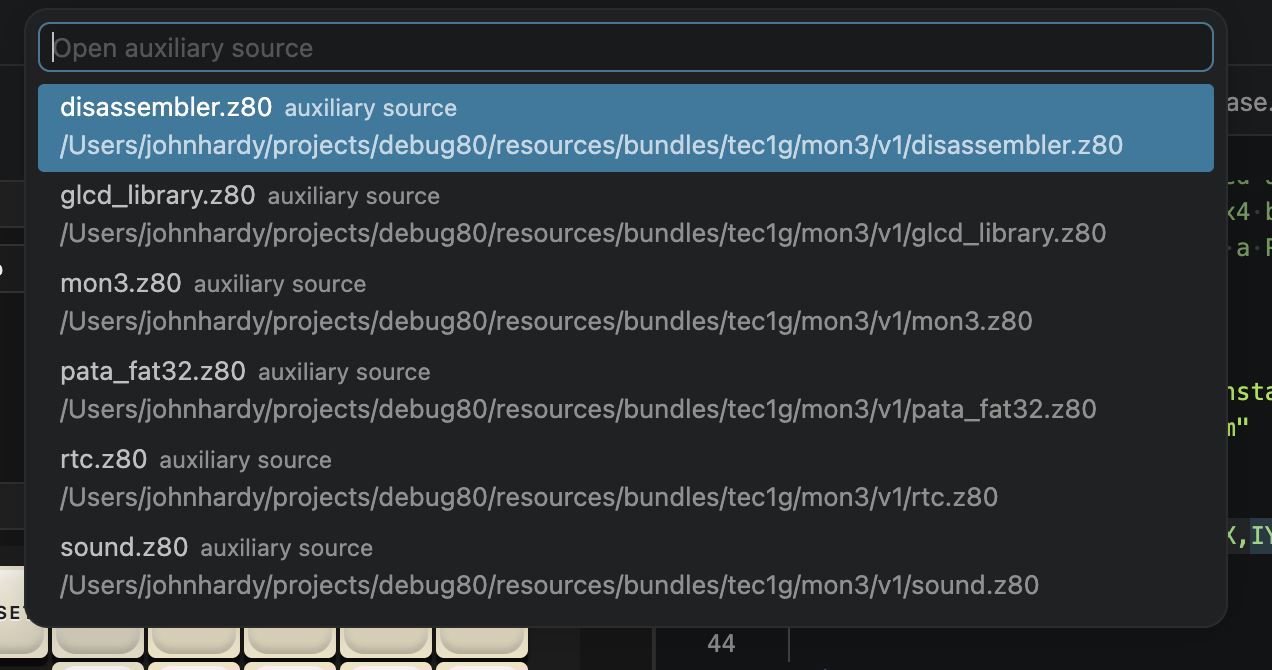
When execution enters monitor code, the current PC may point outside your source file. Debug80 can open the monitor source or listing material for the active platform profile.
Run:
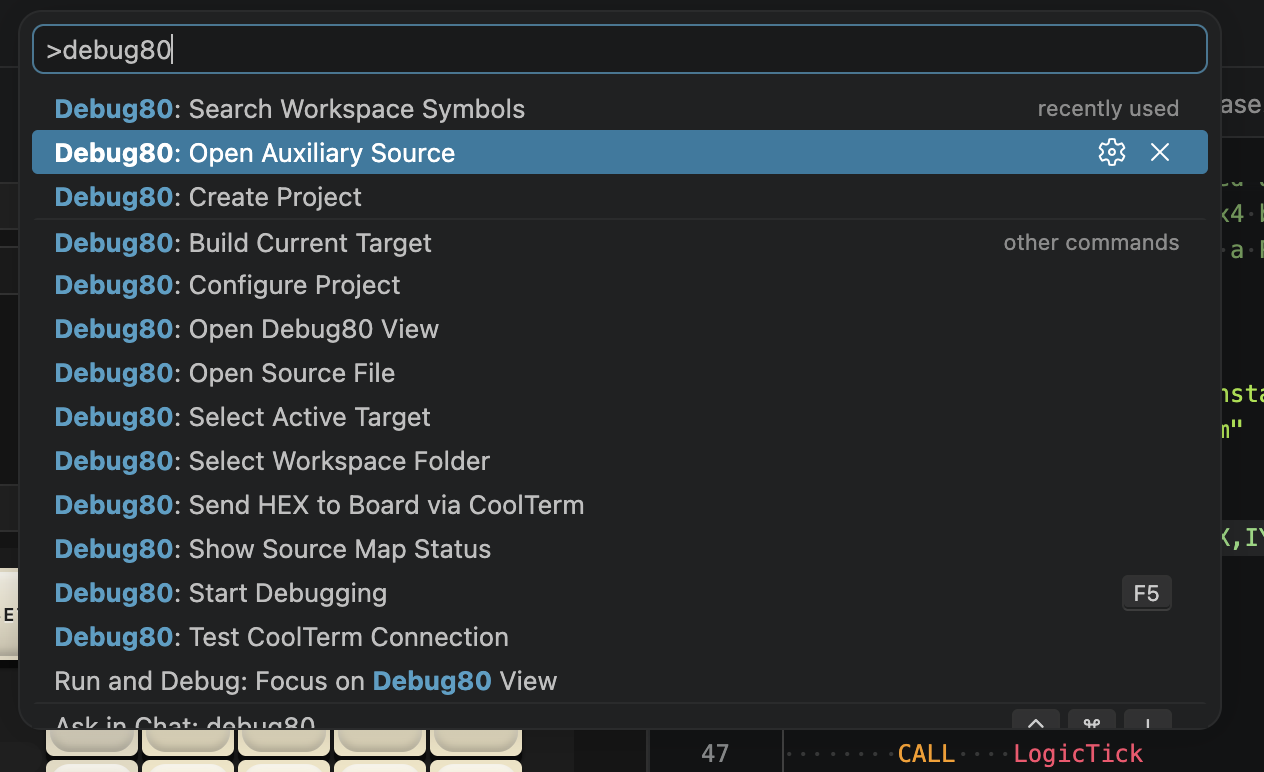
Debug80: Open ROM Source
Use this when a monitor call does something unexpected or when the call stack shows an address inside the ROM.
Image placeholder: Command Palette showing Debug80: Open ROM Source.
Image placeholder: MON-3 source or listing open beside user source.
ROM source is especially useful when your program calls a monitor routine. If a call changes registers you expected to preserve, or if control returns somewhere unexpected, opening the ROM source gives you the surrounding monitor code instead of leaving you at an unexplained address.
Bundled Assets
Debug80 ships bundled ROM assets for the built-in monitor profiles. The TEC-1G / MON-3 kit refers to paths such as:
roms/tec1g/mon3/mon3.bin
roms/tec1g/mon3/mon3.lst
The TEC-1 / MON-1B profile uses the same pattern:
roms/tec1/mon1b/mon-1b.bin
roms/tec1/mon1b/mon-1b.lst
If those files exist in your workspace, Debug80 uses them. If they are absent and the profile has a bundled asset entry, Debug80 uses the copy packaged with the extension.
Run this command when you want local copies:
Debug80: Copy Bundled Assets into Workspace
Copy assets when you want to inspect the monitor listing, compare a ROM or keep a project self-contained. You do not need local copies for ordinary debugging with a bundled profile.
Image placeholder: Explorer showing copied
roms/tec1g/mon3assets.
Before Moving On
You are ready for hardware transfer when you can identify the .hex file for the active target. The board transfer sends that file, not the source file and not the source map.