Use The Debug80 Panel

The Debug80 panel keeps the project controls and TEC-1G hardware views in one accordion. By this point you have already used several controls. This chapter puts the panel together as a whole.

Image placeholder: Full TEC-1G Debug80 accordion showing Project, Displays, Machine, Matrix Keyboard, Serial, Registers and Memory.

Project

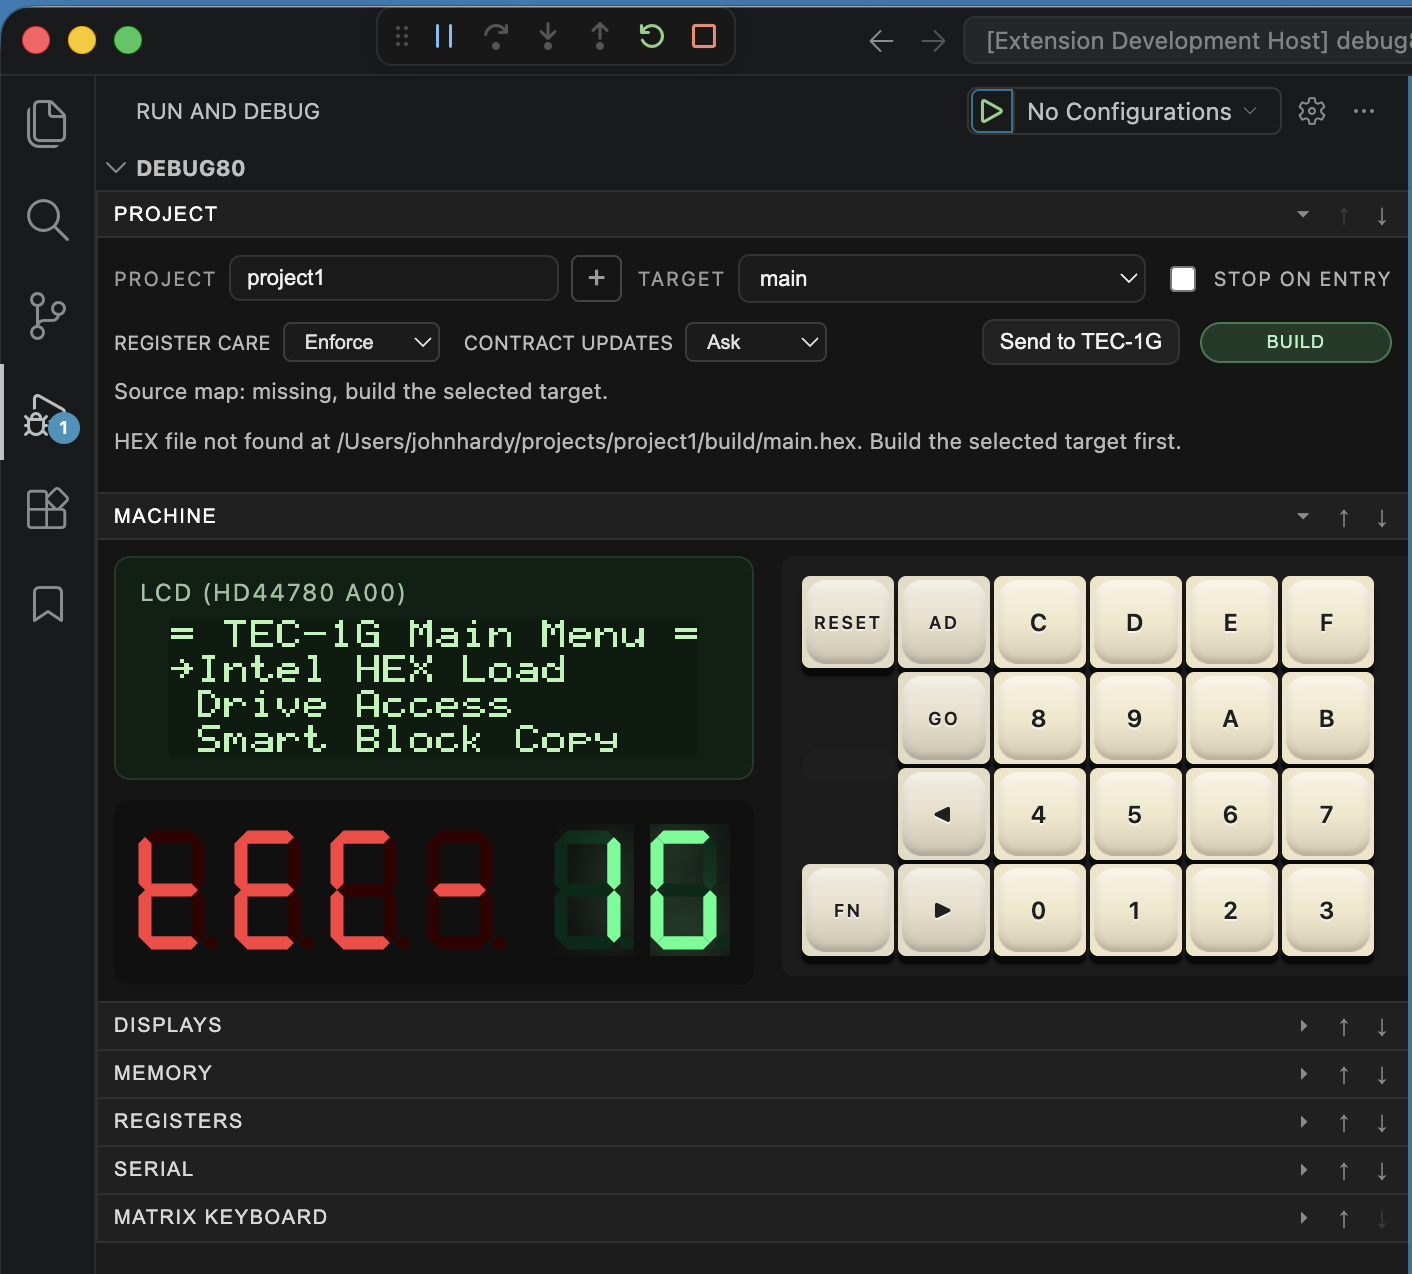
The Project section controls the Debug80 context for the current VS Code window. It names the folder, the active target and the launch options used by the next build.

This section is the place to check before asking why the wrong program ran. The selected folder and selected target define the next launch.

The Project row selects the folder. In a single-folder window, it usually stays fixed. In a multi-folder window, choose the folder before you build.

The Target row selects the runnable program inside that folder. The TEC-1G starter project has one target. Later, when you add another program, this selector decides which program F5 and Build will launch.

Stop on entry pauses the next explicit launch at the first instruction. It is a panel setting for the current VS Code window. Use it when you want a controlled start after changing source.

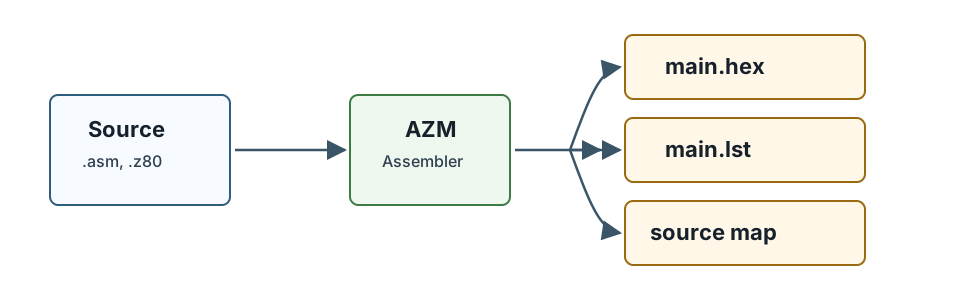
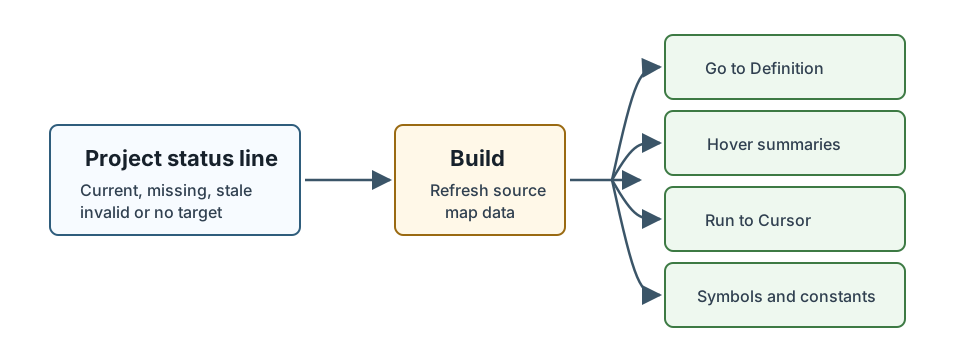
The Project section also reports source-map status. The source map is generated during a successful build and gives Debug80 the symbol and source-line information used by editor navigation, hover text, source breakpoints and debugger symbol views.

Read this line before using source-map-backed features:

  • Source map: current. means the selected target has a readable source map and it appears up to date.
  • Source map: missing, build the selected target. means Debug80 cannot find the source map for the selected target.
  • Source map: stale, build recommended. means one or more mapped source files appear newer than the source map.
  • Source map: invalid, rebuild the selected target. means Debug80 found a source map but could not parse it correctly.
  • Source map: select a target and build. means Debug80 does not yet know which target should supply the source map.

If Go to Definition, hover text, source breakpoints, Run to Cursor or symbol views seem wrong, press Build for the active target.

Source-map status leading to build and source-map-backed features

Image placeholder: Project section close-up with Project, Target, Stop on entry, Register Care, Contract Updates and Build visible.

Image placeholder: Project section source-map status line showing Source map: current.

Register Care

The Register Care selector controls how AZM register-care diagnostics affect restart.

  • Enforce treats register-care problems as launch-blocking diagnostics.
  • Audit lets you inspect the diagnostics as advisory information.
  • Off disables the register-care check for launch.

Book 1 treats register care as a launch option. AZM’s register-care system has its own explanation in the AZM material.

Contract Updates

The Contract Updates selector controls whether Debug80 may apply AZMDoc contract updates while launching.

  • Ask lets Debug80 prompt before applying updates.
  • Auto allows automatic updates.
  • Never keeps launch read-only for contract updates.

Leave this on Ask while learning the workflow.

The safest habit is to change these options only when you know why a launch is blocked or why AZM wants to update a contract. They are useful controls, but they are not required for the first Debug80 workflow.

Displays

The Displays section shows the 128 by 64 graphics LCD, the 8 by 8 RGB LED matrix, system status LEDs and memory expansion indicators.

The status LEDs report TEC-1G system state such as shadow, protect, expand and caps. Read them as hardware state indicators while debugging. Appendix E gives the compact memory and port reference for these names.

The RGB matrix updates when a program writes the matrix row and colour ports. Because matrix programs often refresh rows quickly, the panel gives you a stable picture of the frame the emulator has accumulated.

Image placeholder: Displays section showing GLCD, RGB matrix, system status LEDs and memory expansion indicators.

Programs that scan a matrix often change outputs too quickly for a single port write to be meaningful by itself. The panel is designed to show the accumulated visible state, which is usually what you need while debugging a game, display test or animation.

Machine

The Machine section shows the LCD, seven-segment display and keypad. Chapter 4 used this section for front-panel inspection. Use it whenever your program interacts with the visible TEC-1G controls.

The Machine section is the best section to keep open while writing early TEC-1G examples. It gives immediate feedback for code that writes characters, scans keys or updates the seven-segment display.

Matrix Keyboard

The Matrix Keyboard section shows the larger keyboard interface. It includes MATRIX MODE, Shift, Ctrl, Alt and Caps state.

Click inside the section before typing. You can also click keys directly in the panel. This follows the same focus rule as the front-panel keypad.

Image placeholder: Matrix Keyboard section with Matrix Mode and modifier controls visible.

Serial

The Serial section gives you an emulated serial terminal for the active platform. It contains an output area, a text input and three file controls:

  • SEND FILE
  • SAVE
  • CLEAR

Use the text field to send a line of serial input to the emulator. Use SEND FILE when a monitor or program expects a text or HEX stream through the emulated serial input.

This is separate from the hardware transfer in Chapter 7. The Serial section talks to the emulator. Send to Board talks to CoolTerm, which talks to the physical TEC-1G.

Image placeholder: Serial section showing output area, input field, SEND FILE, SAVE and CLEAR.

This distinction prevents a common mistake. Sending a file through the Serial section feeds the emulated machine. Sending a HEX file to the board uses CoolTerm and affects real hardware.

File send is paced rather than injected as one instant block. Monitor software often expects input at human or device speed, so a paced send is more faithful to the serial path you will use on hardware.

Registers And Memory

The Registers and Memory sections expose the CPU state and RAM views described in Chapter 4. Keep them open when stepping through code. Close them when you need more space for display or serial work.

The memory view is most useful while paused. If the program is running, pause it before reading memory around PC, SP or an absolute address.

A Practical Panel Layout

For early programs, keep Project, Machine, Registers and Memory open. That gives you launch control, visible hardware output, CPU state and memory state.

For display-heavy programs, open Displays and close Memory until you need it. For serial workflows, open Serial and keep Project visible so you can rebuild quickly.

The panel remembers open accordion sections in the webview state. If your view looks different from a screenshot, open the section named in the text and continue.