Run The Debugger
Debugging means running a program under control. You can stop execution, inspect registers and memory, step one instruction at a time, and continue when you are ready.
Build The Target
In the Project section, select the target you want to run, then click Build. Debug80 hands the target to AZM, loads the assembled program into the emulated Z80 and launches the selected platform.
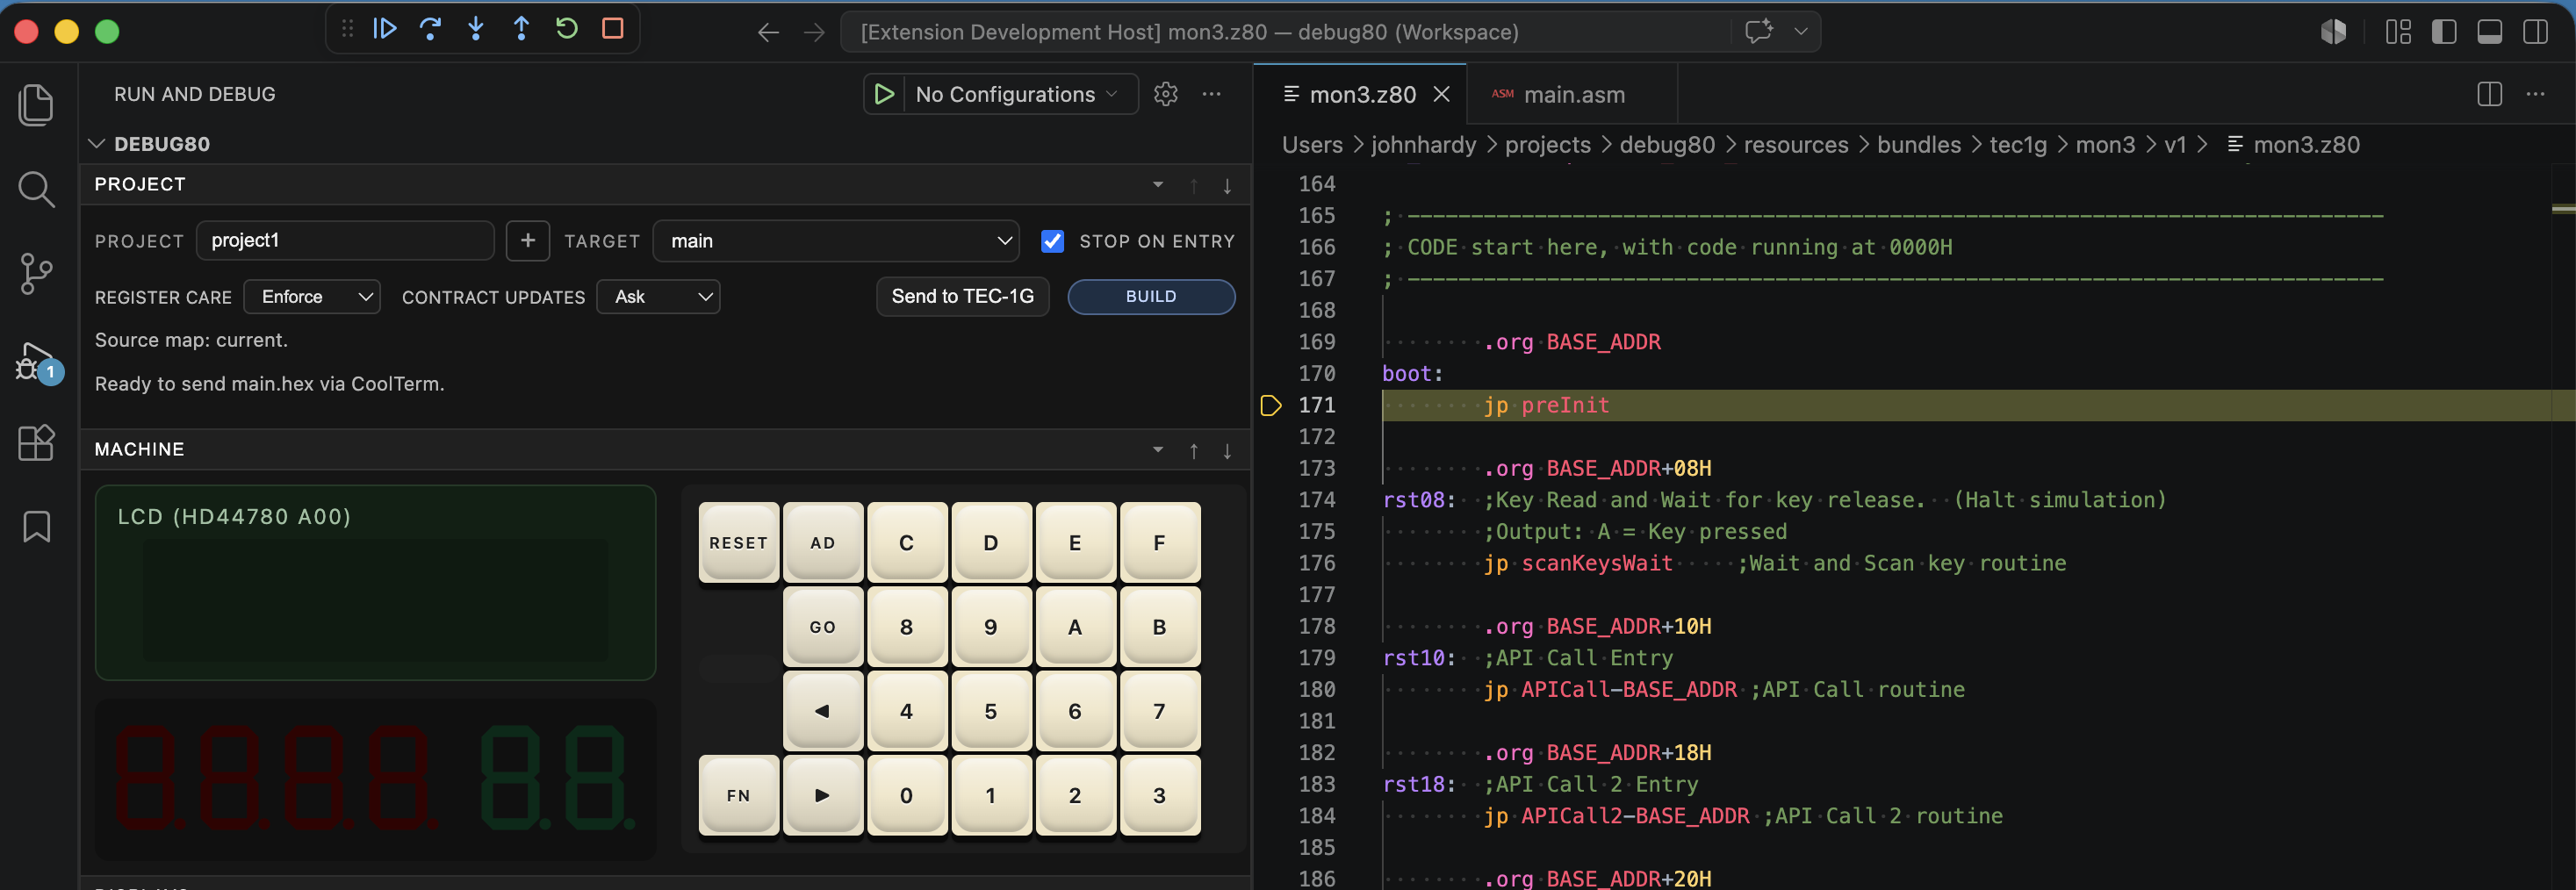
Stop on entry decides what happens the instant the machine starts. Cleared, the program runs straight away. Ticked, Debug80 halts at the first instruction the Z80 executes: address $0000 in the MON-3 ROM, before user code begins.
This launch also writes the build artifacts. The order is what matters here: AZM assembles the source, then Debug80 loads and debugs the result.
The Debug Toolbar
The VS Code debug toolbar controls the emulated Z80 while a debug session is running. Use the buttons when you are learning the workflow; use the shortcuts once the controls become familiar.

Left to right:
- Continue / Pause — continue from the current instruction. While the program is running, the same button becomes Pause.
- Step Over — press F10 to execute the current instruction and stop at the next instruction in the current flow. When the current instruction calls a subroutine, F10 runs that routine as one action and stops after the call returns.
- Step Into — press F11 to follow execution into a subroutine. In Z80 code, this also follows software interrupts, so stepping into
RST 0x10takes you into the MON-3 service routine. - Step Out — press Shift-F11 to run until the current routine returns to its caller.
- Restart — restart the debug session.
- Stop — end the debug session.
The Program Counter
The Z80 program counter, usually written as PC, holds the address of the next instruction. When the debugger pauses, PC tells you where execution will resume.
Source-level debugging connects that address back to your assembly source. The source map from the last successful build tells Debug80 which source line produced the instruction at the current PC. The editor shows the source line; the register view shows the machine address.
When Stop on entry is ticked, the first pause is at $0000 in the monitor ROM. Set a breakpoint in your own source when you want the debugger to run from reset to your program.
Step, Then Inspect
Use F10 when you want to stay in your program and move past calls as single operations. Use F11 when the called code matters and you want to see the instructions inside it.
Use Shift-F11 after F11 has taken you into a routine and you have seen enough detail there. This is the smallest useful debugging cycle: stop, inspect, step, inspect again.
Set A Breakpoint
Click in the editor gutter beside an instruction line. VS Code adds a red marker, and Debug80 binds it to the Z80 address generated for that line.
Breakpoints bind to instruction addresses. Place them on executable source lines, because instructions generate the addresses Debug80 can stop on. When execution reaches that address, Debug80 pauses before running the instruction.
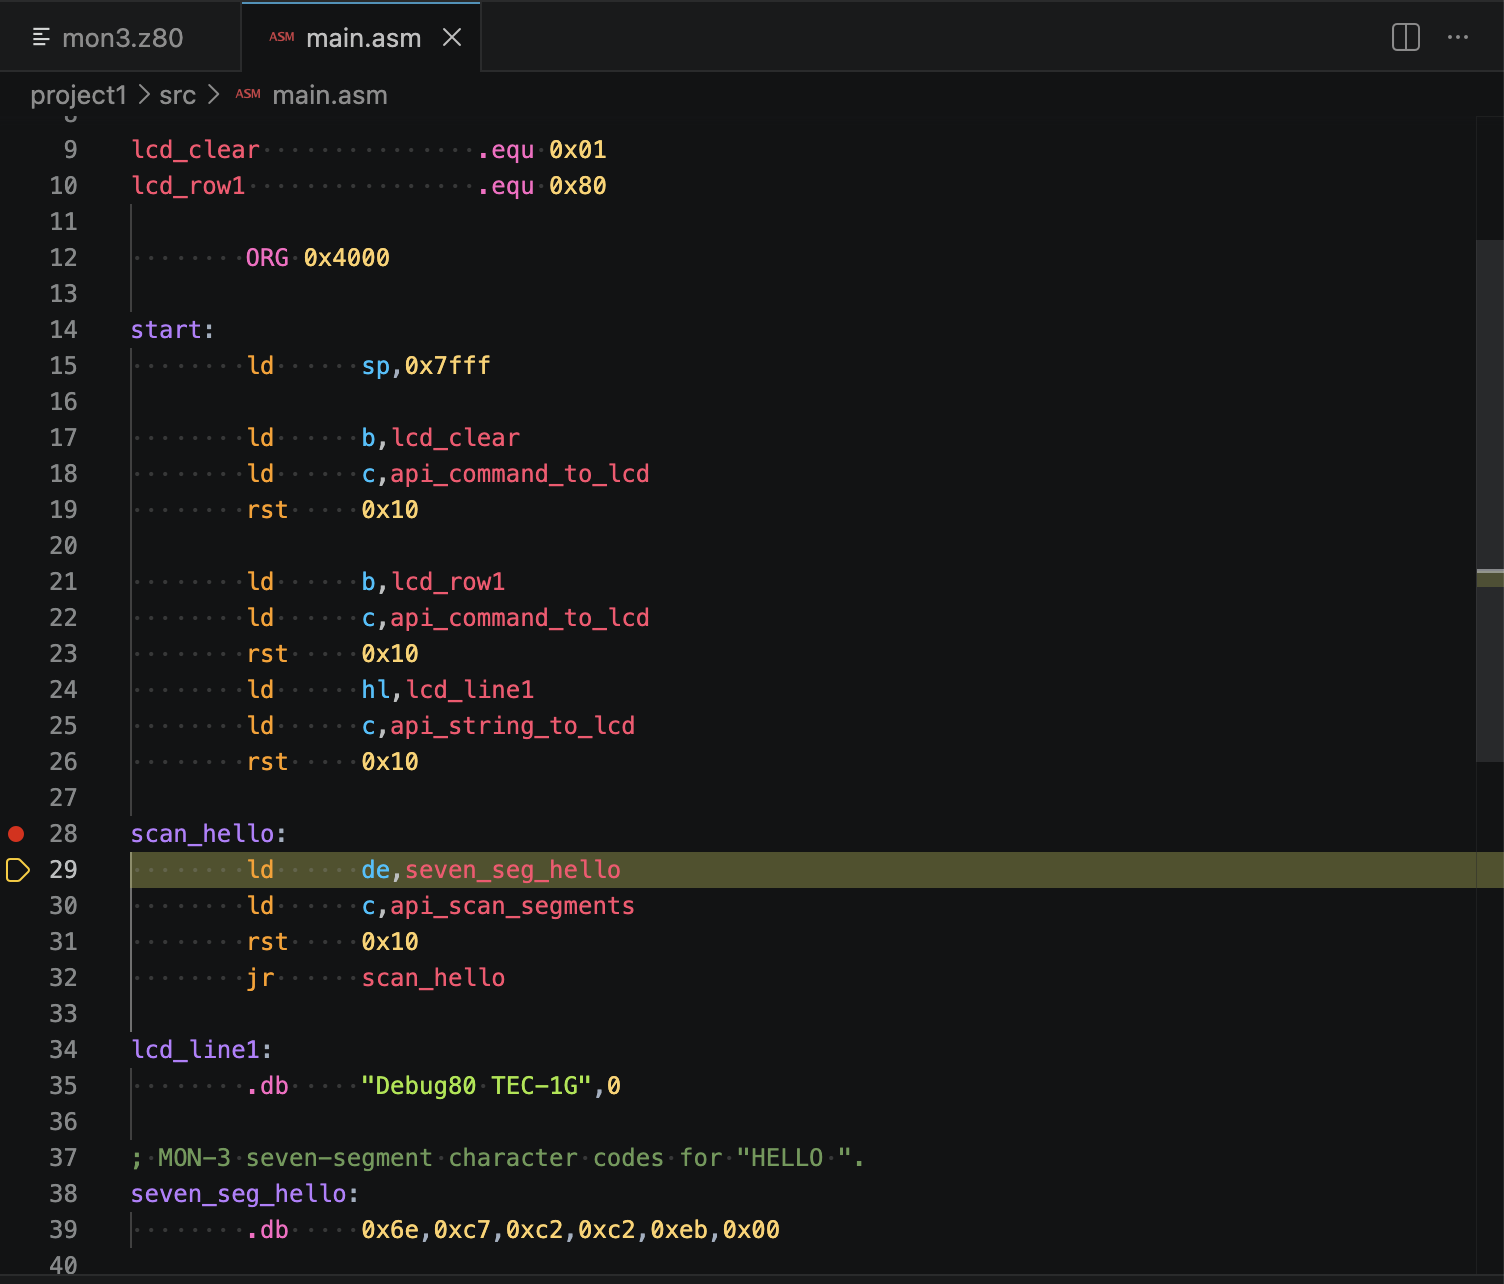
Use Continue to run from the current pause to the next breakpoint. Use Pause when a program is running and you want to inspect its current state.
Run To Cursor
Run to Cursor reaches one spot without leaving a breakpoint behind. During a session, right-click an instruction line and choose it from the editor menu.
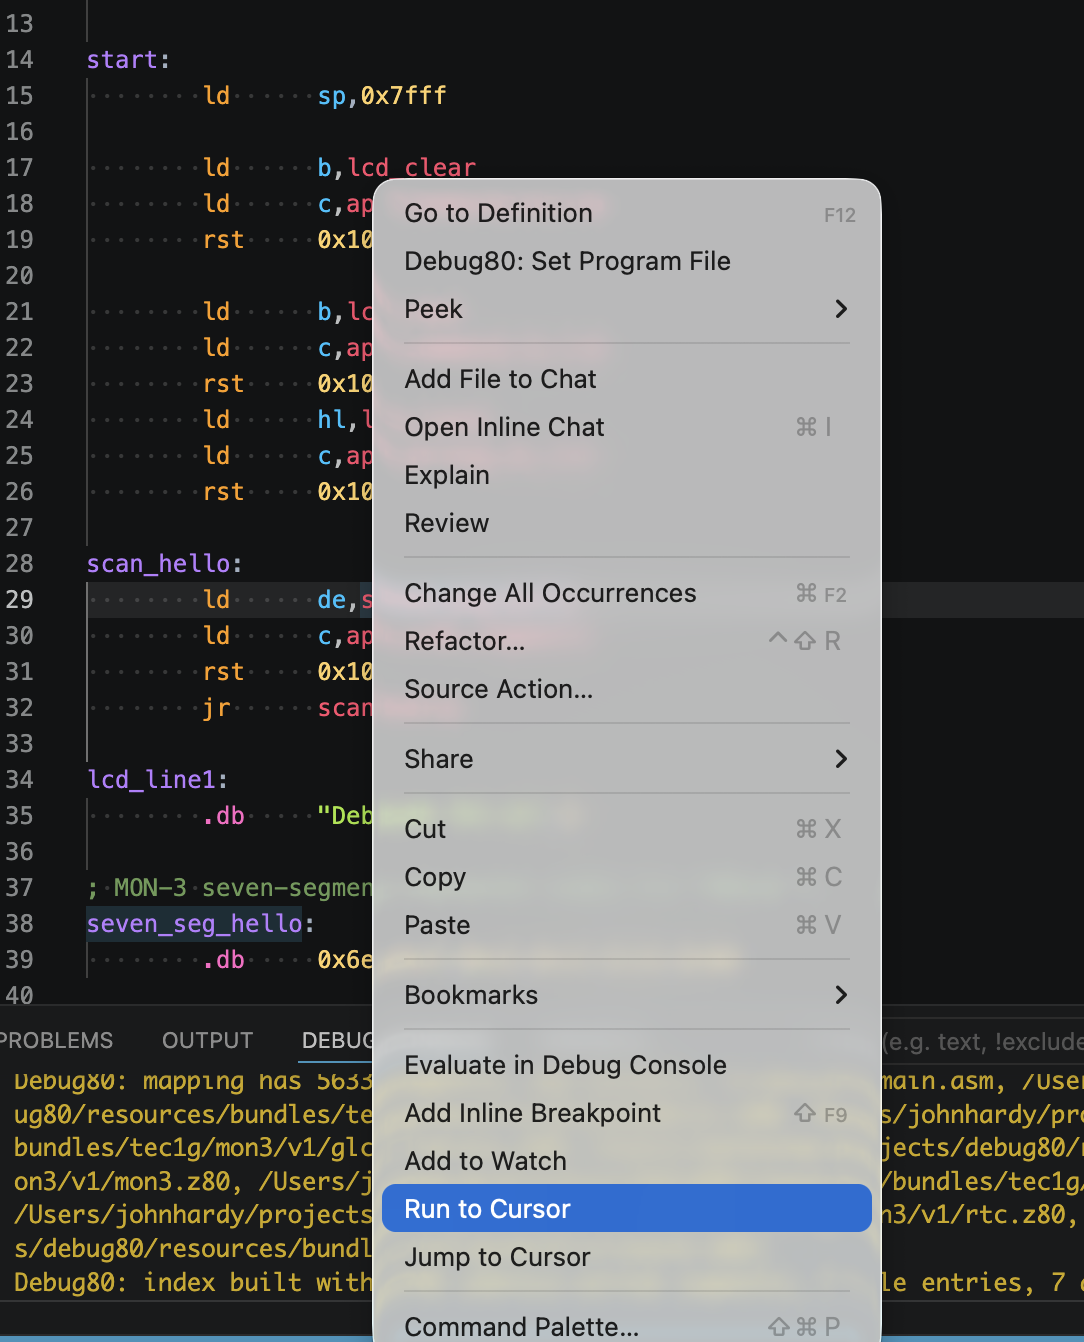
Debug80 resolves the line through the source map, runs to the matching machine address and stops there.
Like every source-line feature, this leans on the last successful build. If a line will not resolve, build the target again to refresh the source map, then place the cursor and retry.
Conditional Breakpoints
A plain breakpoint stops every time it is hit. A conditional one stops only when the machine is in a state you care about. Right-click a breakpoint and choose Edit Breakpoint.
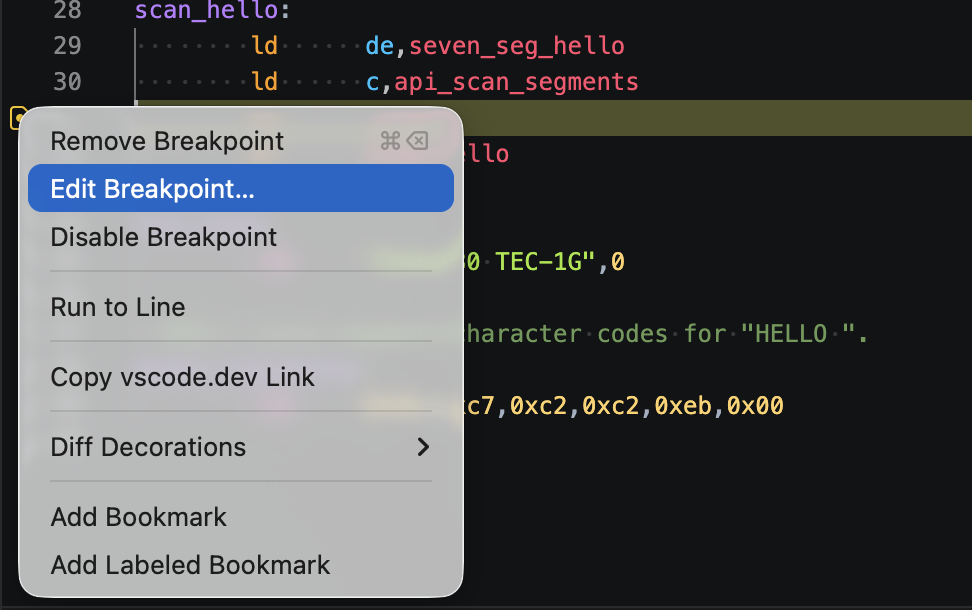
Type a Debug80 expression into the inline editor. The condition can use registers, flags, symbols from the source map and byte reads from memory. The same idea lets you stop when a counter reaches zero, a pointer lands on an address, or a key value appears, instead of breaking on every pass.
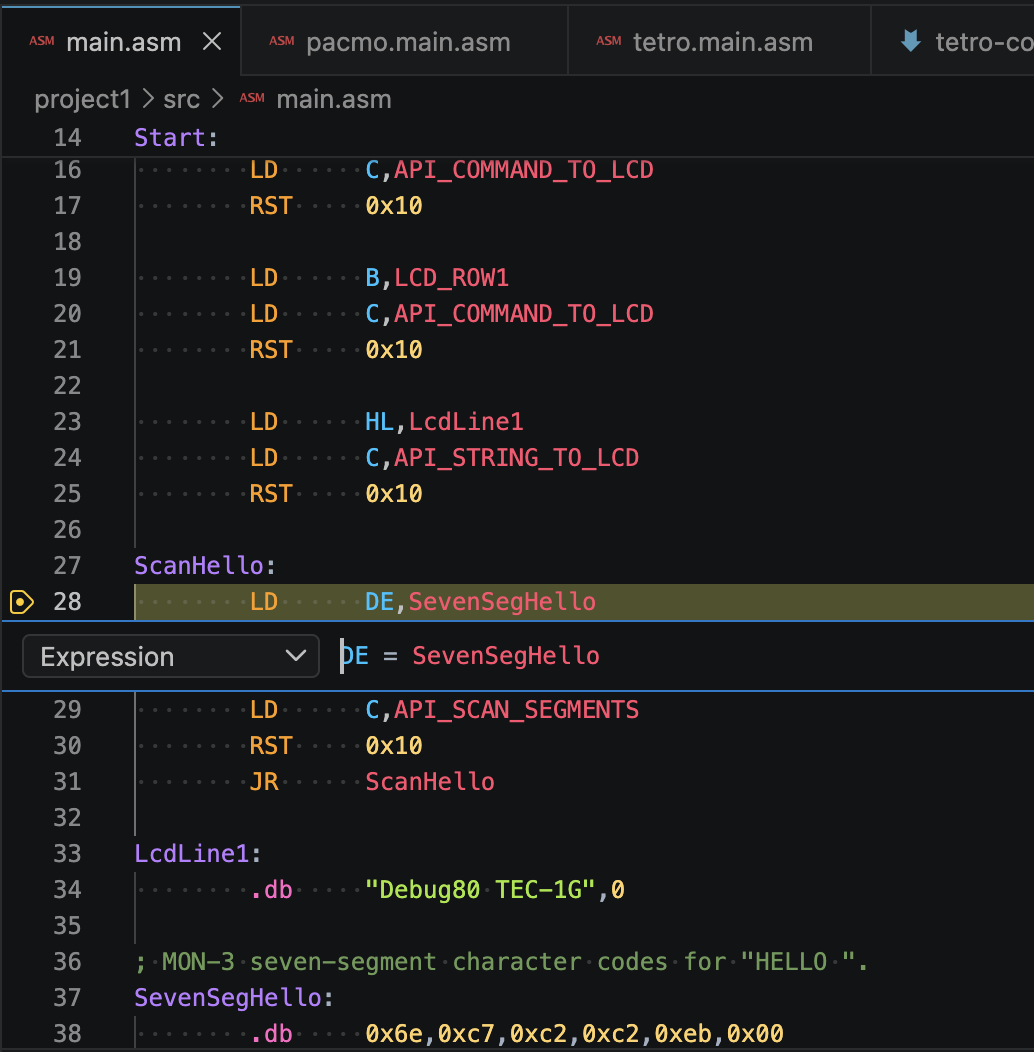
Each time execution reaches the line, Debug80 evaluates the expression. A true or non-zero result stops the program; a false or zero result lets it run on. If the expression itself errors, Debug80 writes the error to the Debug Console and treats the condition as false.
Conditional breakpoints share the expression language with the Watch panel. Appendix A lists the registers, flags, symbols, memory reads and operators you can use.