Install And Add A Folder
Debug80 runs inside Visual Studio Code. Start with VS Code, the Debug80 extension and a workspace folder for your Z80 project.
Open Visual Studio Code and install the current VS Code build for your operating system. Debug80 declares support for VS Code 1.92.0 and later.
Install Debug80
Open VS Code and choose Extensions from the Activity Bar.
Search for debug80, install Debug80 IDE for Z80 Development by jhlagado, then reload the window if VS Code asks.
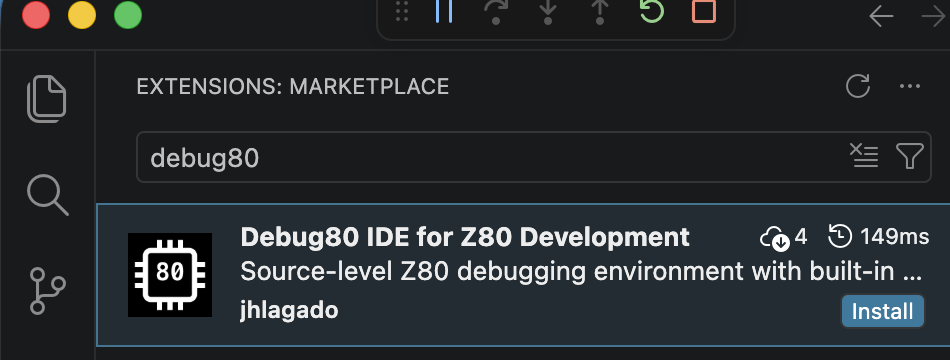
Debug80 adds syntax highlighting for .asm and .z80 files, a z80 debugger and a Debug80 view in the Run and Debug sidebar. You do not need a separate extension such as Z80 Assembly just for syntax highlighting.
Find The Debug80 Panel
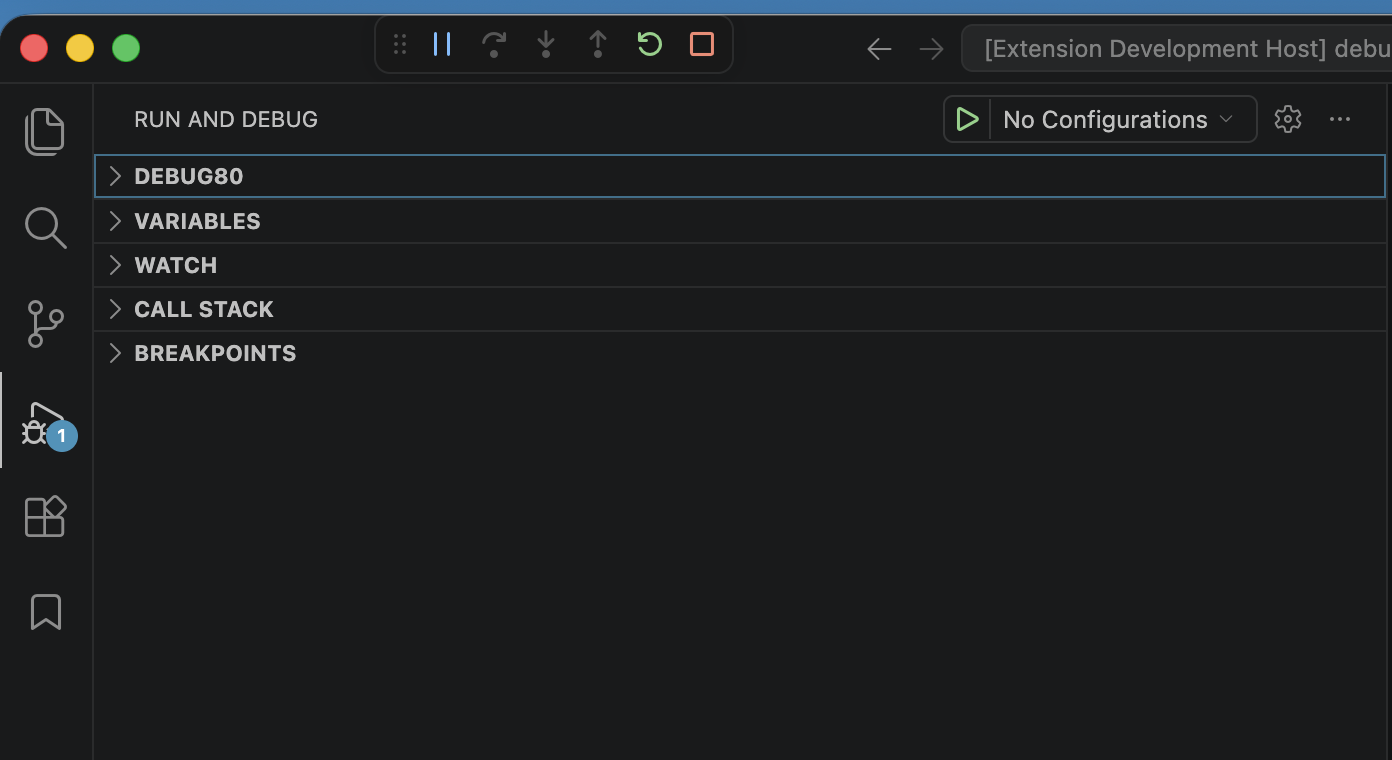
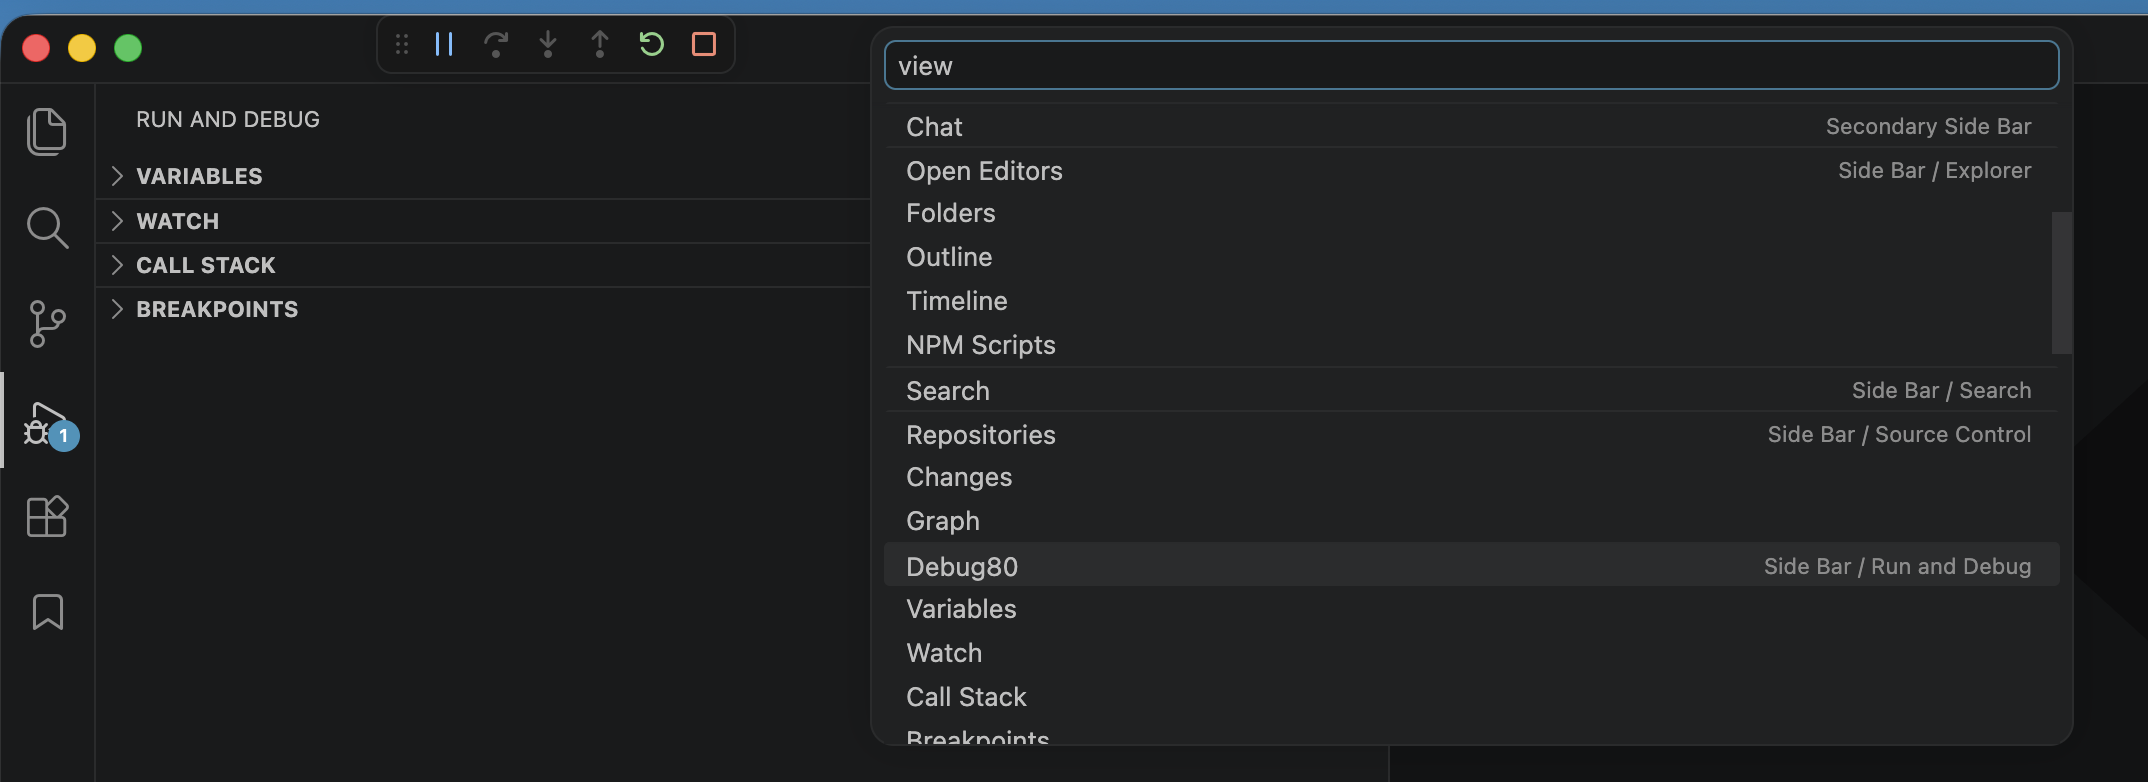
Open the Run and Debug sidebar. The Debug80 panel appears there with the standard VS Code debug views.
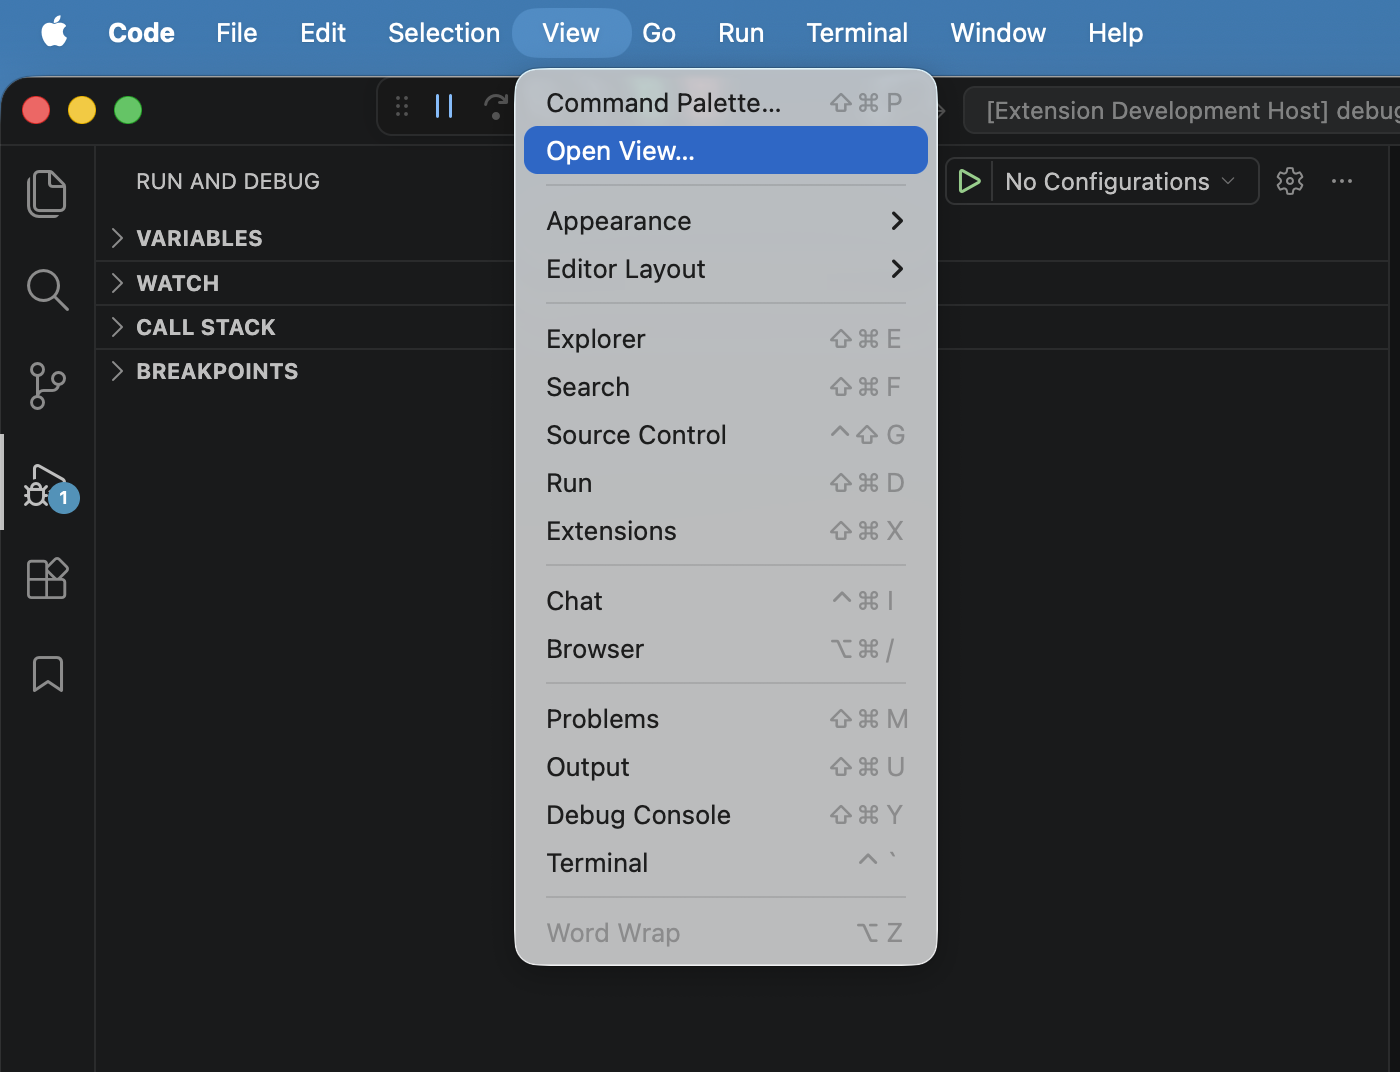
If the panel is hidden, open it from VS Code’s view picker.
Add A Project Folder
Debug80 works from folders in the VS Code workspace. Create one project folder for each TEC-1G application or program you want to build. Each workspace folder is a candidate project: a place for source files, build output and project settings. A folder becomes a Debug80 project after it is initialized.
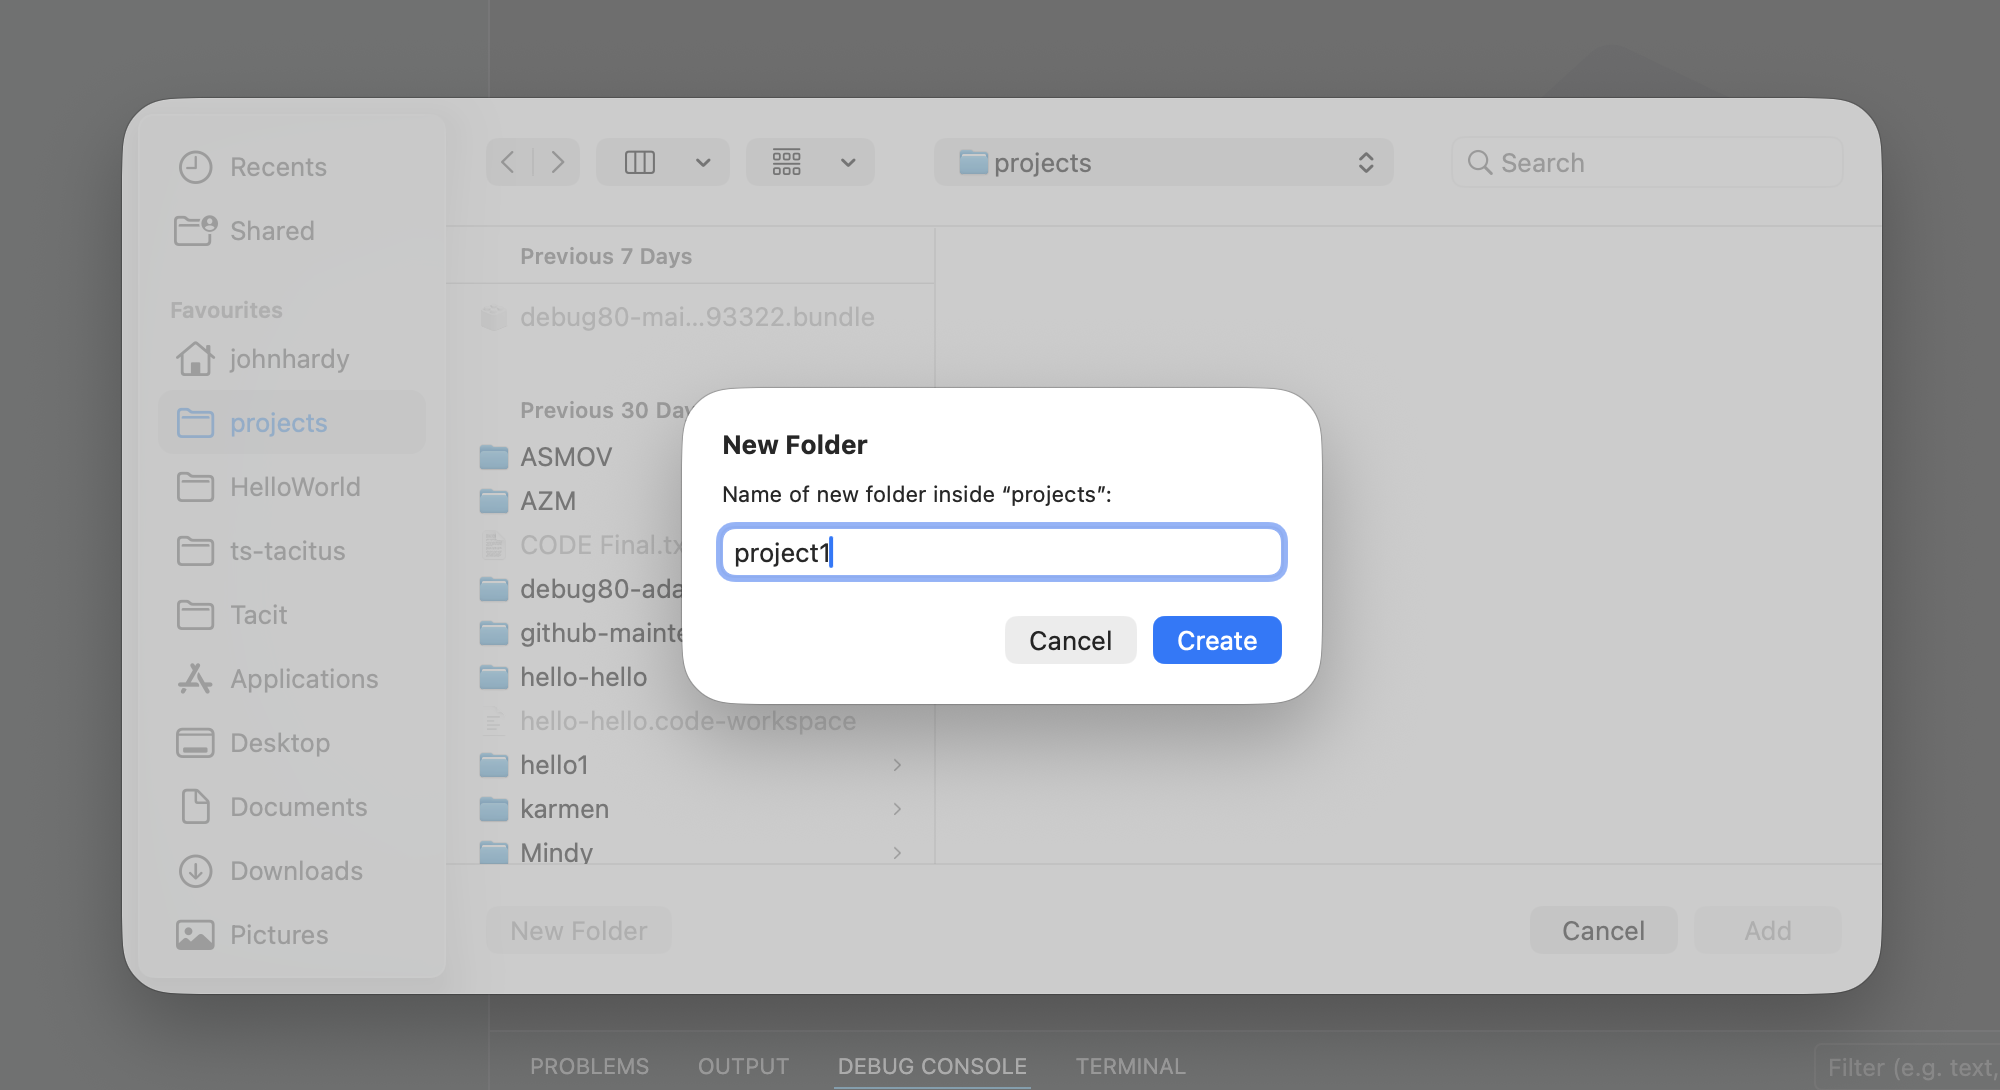
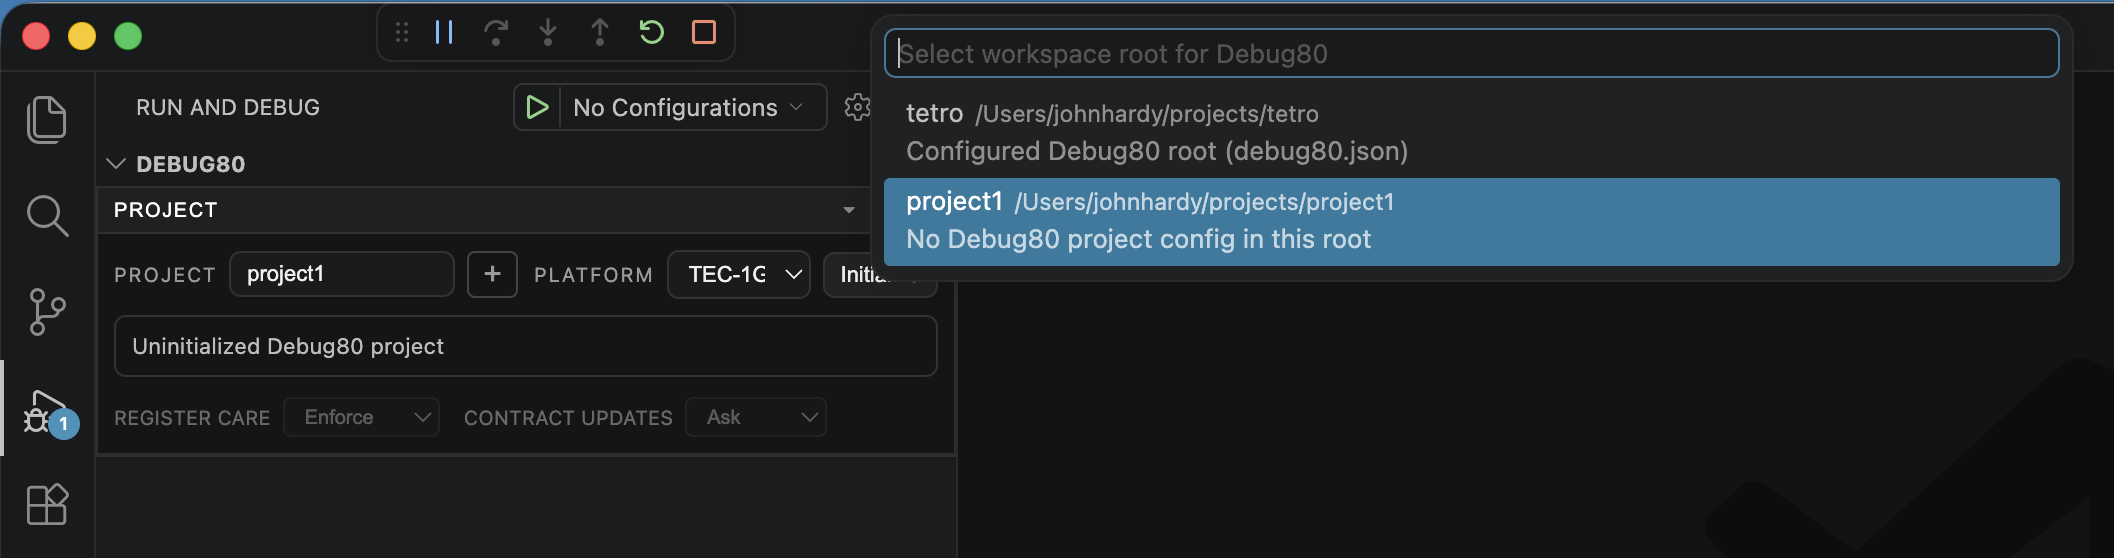
Click the + button in the Debug80 Project section. Debug80 opens a folder picker, adds the selected folder to the VS Code workspace and selects that folder in the Project section.
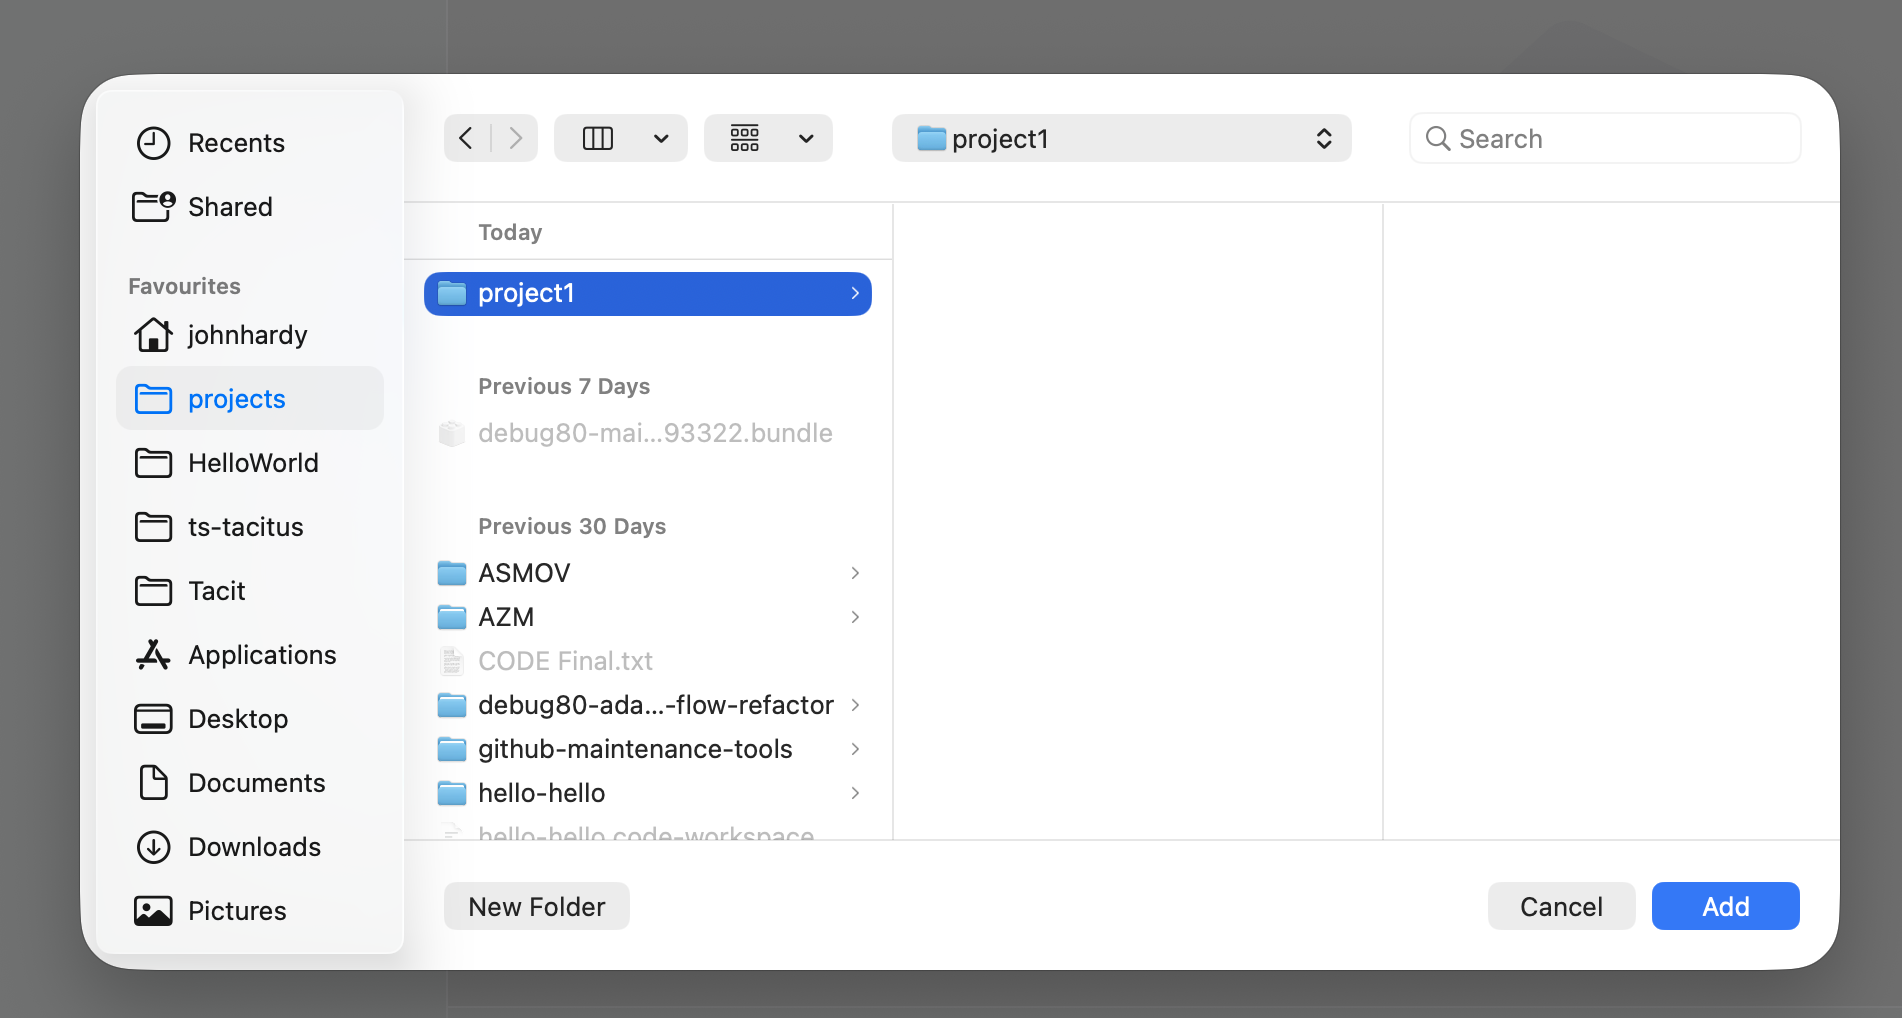
You can add an existing folder that already holds your source, or create a fresh one from the folder picker. This example creates a new folder called project1.
Select the new folder and add it.
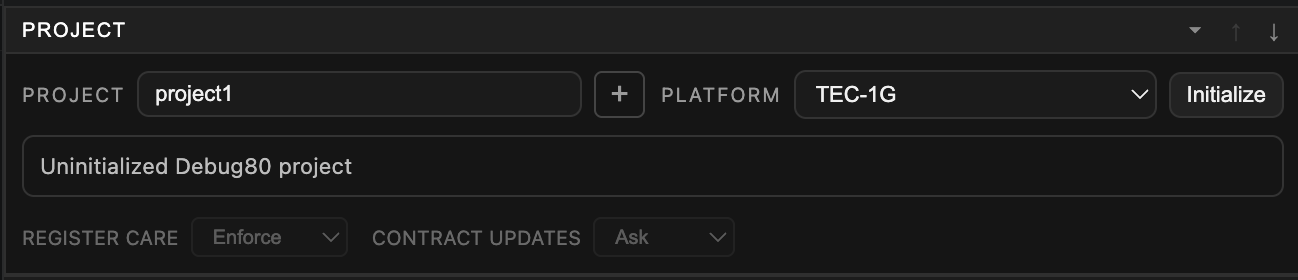
A folder that already contains Debug80 project settings opens as the active project. A new folder appears as an uninitialized project, with the platform selector and Initialize action visible.
When Debug80 asks whether to initialize the selected folder, choose Initialize to create the starter project files. Choose Not Now when you want to leave the folder selected and initialize it later.
You can also choose the platform in the Project section, then click Initialize yourself.
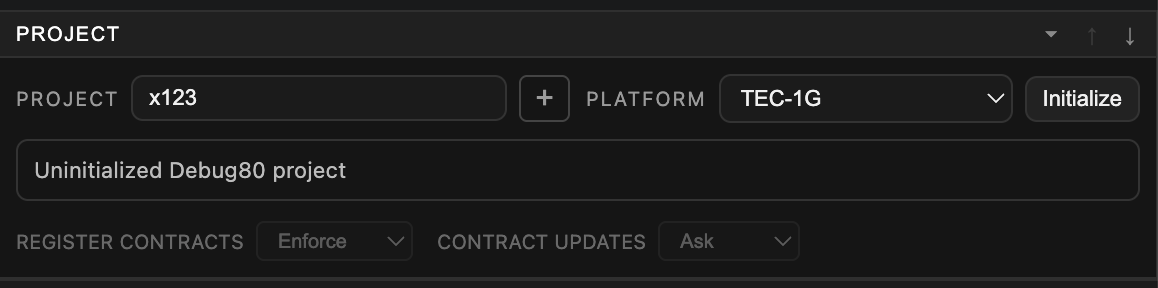
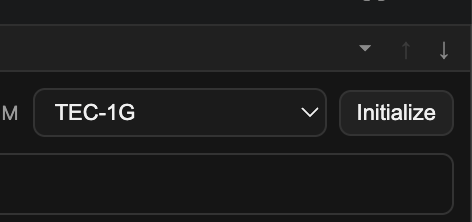
Initializing the folder makes it a full Debug80 project: one you can build, debug and send to hardware.
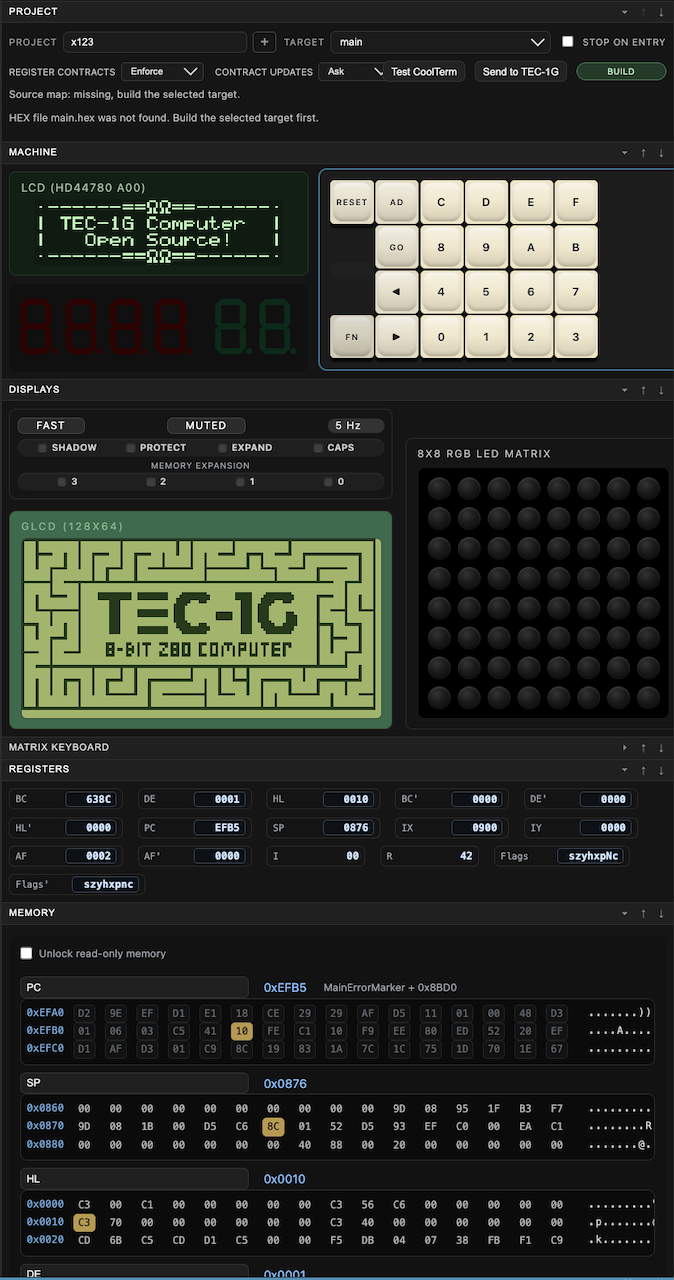
The Debug80 interface changes with the selected target and active hardware options. For example, a target that uses the matrix keyboard shows the keyboard expanded in the Machine section.
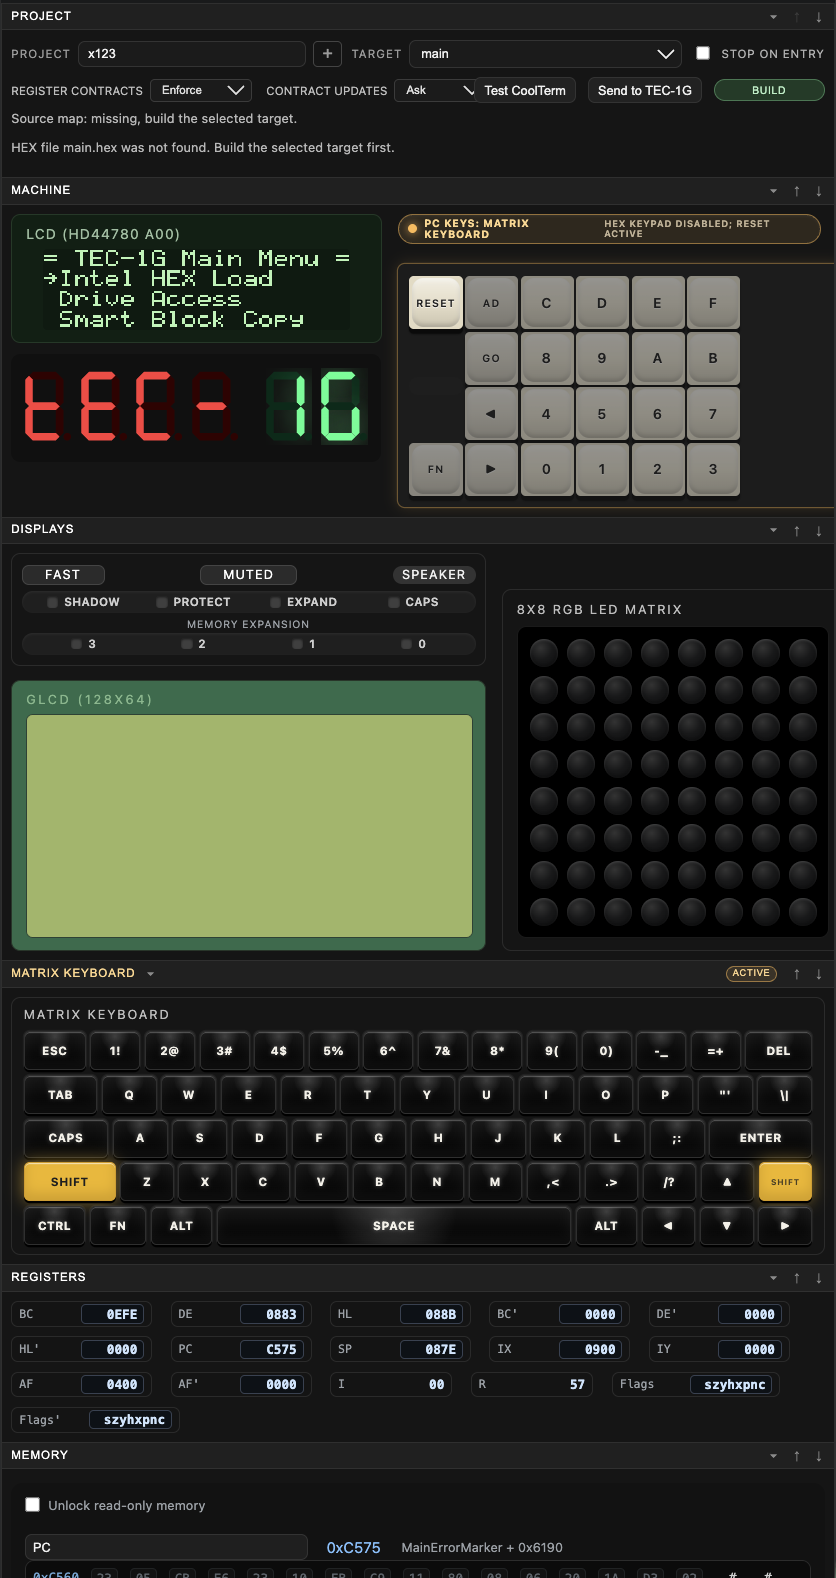
When the workspace holds more than one folder, the Project selector chooses which one Debug80 works on. It marks initialized projects separately from folders that still need initialization.
VS Code’s File > Add Folder to Workspace command still works. The Debug80 + button is the direct route when you are adding a folder for Debug80 work.