Building and running
Build assembles your program. Run assembles it and starts the emulated machine.
A build
With main selected, Build assembles that target.
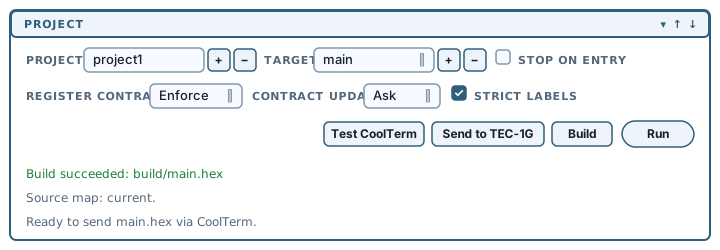
Debug80 hands your entry file to the assembler, writes the output into the target's outputDir, and stops. The panel reports what happened on its own line:
Build succeeded: build/main.hexIf the build fails, that line turns red with a warning mark, a red ! indicator appears beside the Build button, and the errors arrive in the Problems panel attached to the lines that caused them. The full assembler output goes to the Debug80 output channel.

The build/ directory now contains:
build/
  main.hex               the program, as Intel HEX
  main.bin               the same bytes, raw
  main.d8.json           the source map
  main.lst               the assembler listing
  main.regcontracts.txt  the register contracts report
main.hex is what runs, on the emulator and on real hardware alike. main.d8.json is the source map: it records which addresses came from which lines of which files, and every source-level debugging feature depends on it.
A Glimmer target also emits its generated assembly as main.asm. Glimmer targets describes its build pipeline and output.
The source map status line
Under the build line the panel shows the current source-map status:
Source map: current.Five other messages are possible, and each includes the required remedy:
| Line | Meaning |
|---|---|
Source map: select a target and build. | No target is selected. |
Source map: missing, build the selected target. | The target has never been built. |
Source map: stale, build recommended. | Source has changed since the last build. |
Source map: unreadable, rebuild the selected target. | The file exists but could not be read. |
Source map: invalid, rebuild the selected target. | The file was read but did not parse. |
A stale map can send breakpoints and stepping to old locations. A missing, unreadable or invalid map disables the editor and debugger features that depend on it. The source-map status line is the first diagnostic when debugging behaves unexpectedly.
A run
Debug80 builds the target, then launches it: it loads the monitor ROM and your program into an emulated TEC-1G and starts a debug session.
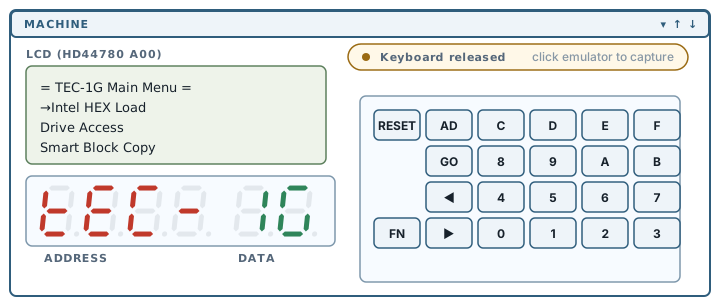
Run keeps its label and reports the session state in its colour: grey when nothing is running, amber while starting, green while running, blue when paused at a breakpoint. Both buttons are disabled while a session is starting.
If a session is already running, Run stops it and starts again, so after an edit one press gets you the new build on a fresh machine.
Debug80 supplies the debug configuration itself, so there is no launch.json to write.
Choosing between Build and Run
Run suits the edit-and-test cycle. Build suits work that needs only the artifacts: sending a HEX file to real hardware, checking whether code assembles, or building a target other than the one currently being debugged.
Stop on entry
The Stop on entry checkbox pauses the CPU at the machine's launch address, and applies to this VS Code window for as long as it is open.
The other three controls
The row below Stop on entry holds Register Contracts, Contract Updates and Strict labels.
Register Contracts defaults to Enforce, which means AZM checks how your routines use registers and fails the build when it proves a conflict. If a build fails complaining about registers rather than syntax, that is the control responsible, and setting it to Audit reports the problem and lets the build finish. It is also why a build writes main.regcontracts.txt.
Appendix D covers all three: what they change, which of them can rewrite your source, and which one is saved into debug80.json.
Reading the state as data
Debug80: Copy Project Status (JSON) copies the panel's full view of the project as JSON. The result records the project state, target list, selected target, build, source map and hardware status.