Debug80 installation
Debug80 is a Z80 development environment that runs inside VS Code. You write assembly, it assembles the code, loads it into an emulated TEC-1G, and lets you step through your own source while the emulated machine runs.
The extension carries the AZM assembler, the Glimmer compiler and the TEC-1 and TEC-1G emulation inside itself.
VS Code
Debug80 needs VS Code 1.100.0 or later, available from code.visualstudio.com.
The Debug80 extension
The Extensions view in the Activity Bar provides the installation route. A search for debug80 finds Debug80 IDE for Z80 Development, published by jhlagado.
The extension provides syntax highlighting for .asm, .z80 and .asmi files, and Glimmer support for .glim files. It sets the language mode each time one of these files opens, taking precedence over any other installed Z80 assembly extension.
Find Debug80 in the sidebar
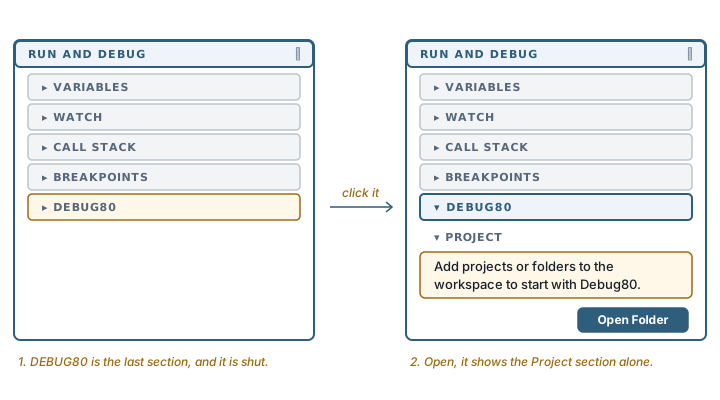
Debug80 appears under the standard Run and Debug icon in the Activity Bar. Inside that sidebar, Debug80 follows VS Code's Variables, Watch, Call Stack and Breakpoints sections. It is the last section and is collapsed by default.
In the Run and Debug sidebar, expanding DEBUG80 at the bottom of the list reveals the panel.
The book calls it the Debug80 panel from here on.
The extension contributes this section, so it appears once Debug80 is installed, and opening it starts the extension. The section requires the extension to be installed and enabled. VS Code's View > Open View... picker also reaches Debug80 directly.
The empty state
With no folder open, the panel displays:
Add projects or folders to the workspace to start with Debug80.and one button, Open Folder.

The panel with a program running
With a project open and a program running, the section contains the project and machine controls:
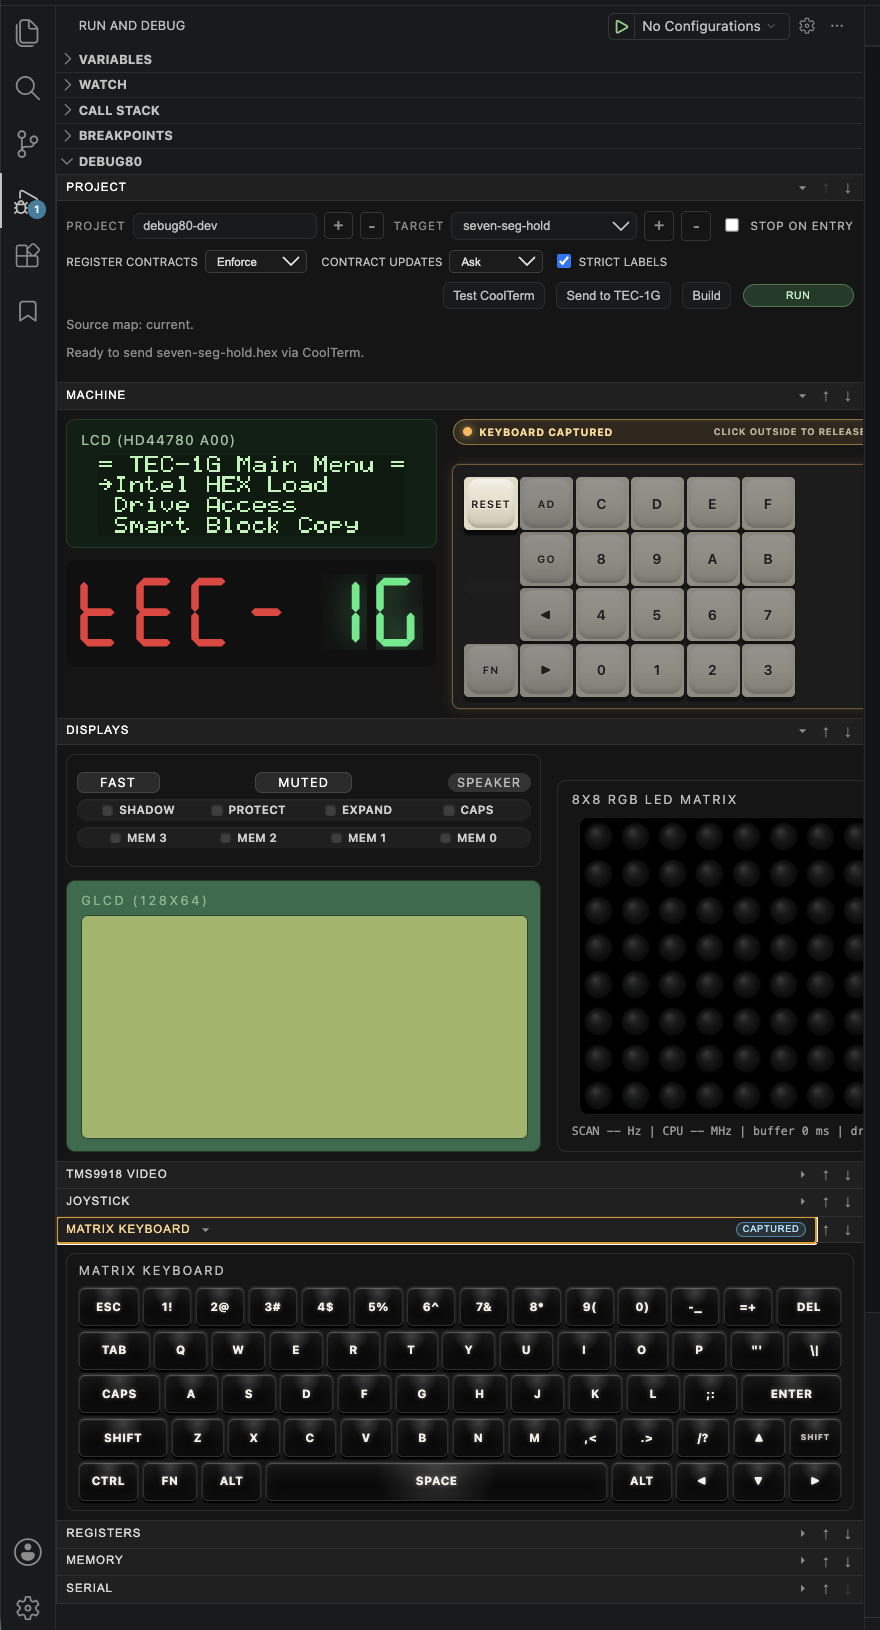
Everything below DEBUG80 belongs to Debug80: the project row, the emulated machine, its displays, a keyboard and further sections for registers, memory and the serial line.